Welcome to the General System Manual!
This document will provide you with all the necessary information you need to use Alchemy.
Whether you are working on new products, recipes, or helping customers get the most from your current products, Alchemy accelerates your chemistry development, sales, and service processes so you can please your customers and monetize more of your work.
Alchemy is customized according to your organization's needs. It will aid you in your everyday work on the operational level or allow for reporting to middle and upper management. The data you are storing in Alchemy can easily be searched and compared, creating an efficient way of working. Delegation of work and proper workload distribution is facilitated through Alchemy as well.
To start the Sign In process, first check your email for the invitation link. If you do not see the email in your inbox try looking in the spam folder or contact your system administrator.

Click the blue button to navigate to the user login portal and select your organization’s sign in option.

Enter your email address and click Next.
After clicking on the button "SET YOUR PASSWORD" you will land on the page shown in Figure 1.2. Here, you need to set up your password. Please keep in mind what the passwords must contain which is explained next to the input fields.

Please keep in mind that a password must be a minimum of 12 characters and contain a lowercase character, an uppercase character, a special character, and a number.
After entering the desired password according to all criteria you will land on the standard Sign In page which you will see every time you want to sign in. Enter your email and password to sign in to Alchemy.
Our advice is to bookmark the standard Sign In page so you will have easy access to it anytime.
If you forget your password, click the button, Forgot password.

A modal will appear where you will be asked to enter your email address and click the button, Send Me Reset Link.

After entering your email, check your inbox again. You should receive an email with the link for the password change. Click on the hyperlinked text "Please request a password change over this link" (Figure 1.6).

After clicking on the link you will land again on the page for the password set up (Figure 1.3). Enter the new password and confirm it, then you will land again on the standard Sign In page (Figure 1.4).
The Home page is the first page you will land after signing in to Alchemy. You can always easily return to this page by clicking the Alchemy logo or My Assignments in the left sidebar menu.
The Home page has the following features and information:

The main part of the login page is My Assignments. It contains the list of processes for which there is a task assigned to you. The list of these processes is sorted according to priority, from highest to lowest.

Each card represents a different process that has a task assigned to you. In the white circle, you can see the priority of the process. The process priority displayed is for all processes in the system, regardless of who is assigned to it in the organization. Each card also displays the:
At the top of the system navigation panel is a Search bar. Alchemy’s search capabilities can be leveraged to quickly locate any process, record, or task related information within the system, allowing for easy access to data.

There are two search options available:
The use of Quick Search will display results in the system for any process, record, task or stage names that match the keywords in the search field.
Result items will be shown as titles with a colored tag at the end of the line representing the type of the search result. The color also represents the status of the search item.

Process tags can have 4 different statuses and colors of icons:
Completed

In progress

Voided

On hold

If you click on any of the search results for processes, the system will open the associated process page.
Record tags can have 2 statuses and colors of icons:
Valid

Invalid

When you click on any of the search results for records, the system will open the record in a new window within the page.
Task tags can have 6 different colors of icons:


When you click on any of the search items for tasks, the system will open the associated task.
System-Wide Search can be accessed by pressing enter after writing a keyword in the search bar or by clicking Show All Results at the bottom of the quick search results. It will return results for all keyword-related items in the system, including titles and content within record fields.

Results can be filtered based on 5 criteria:

For each search item, more details are available.
For Process search results, additional details contain the:

Record search results details contain the:

Task search results details contain the:

Clicking any result will open the associated process, record or task in a pop-up window.
Notifications are a way to inform you about the changes that have occurred in Alchemy. You can be notified about the changes in two ways:
The notification icons are located at the bottom of the blue system navigation panel. New notifications will be displayed as a red dot over the icon with a number, indicating the amount of new notifications. Clicking the icon will display a small pop-up window, listing all notifications with a short description for review. The newest notifications will be listed at the top of the window.
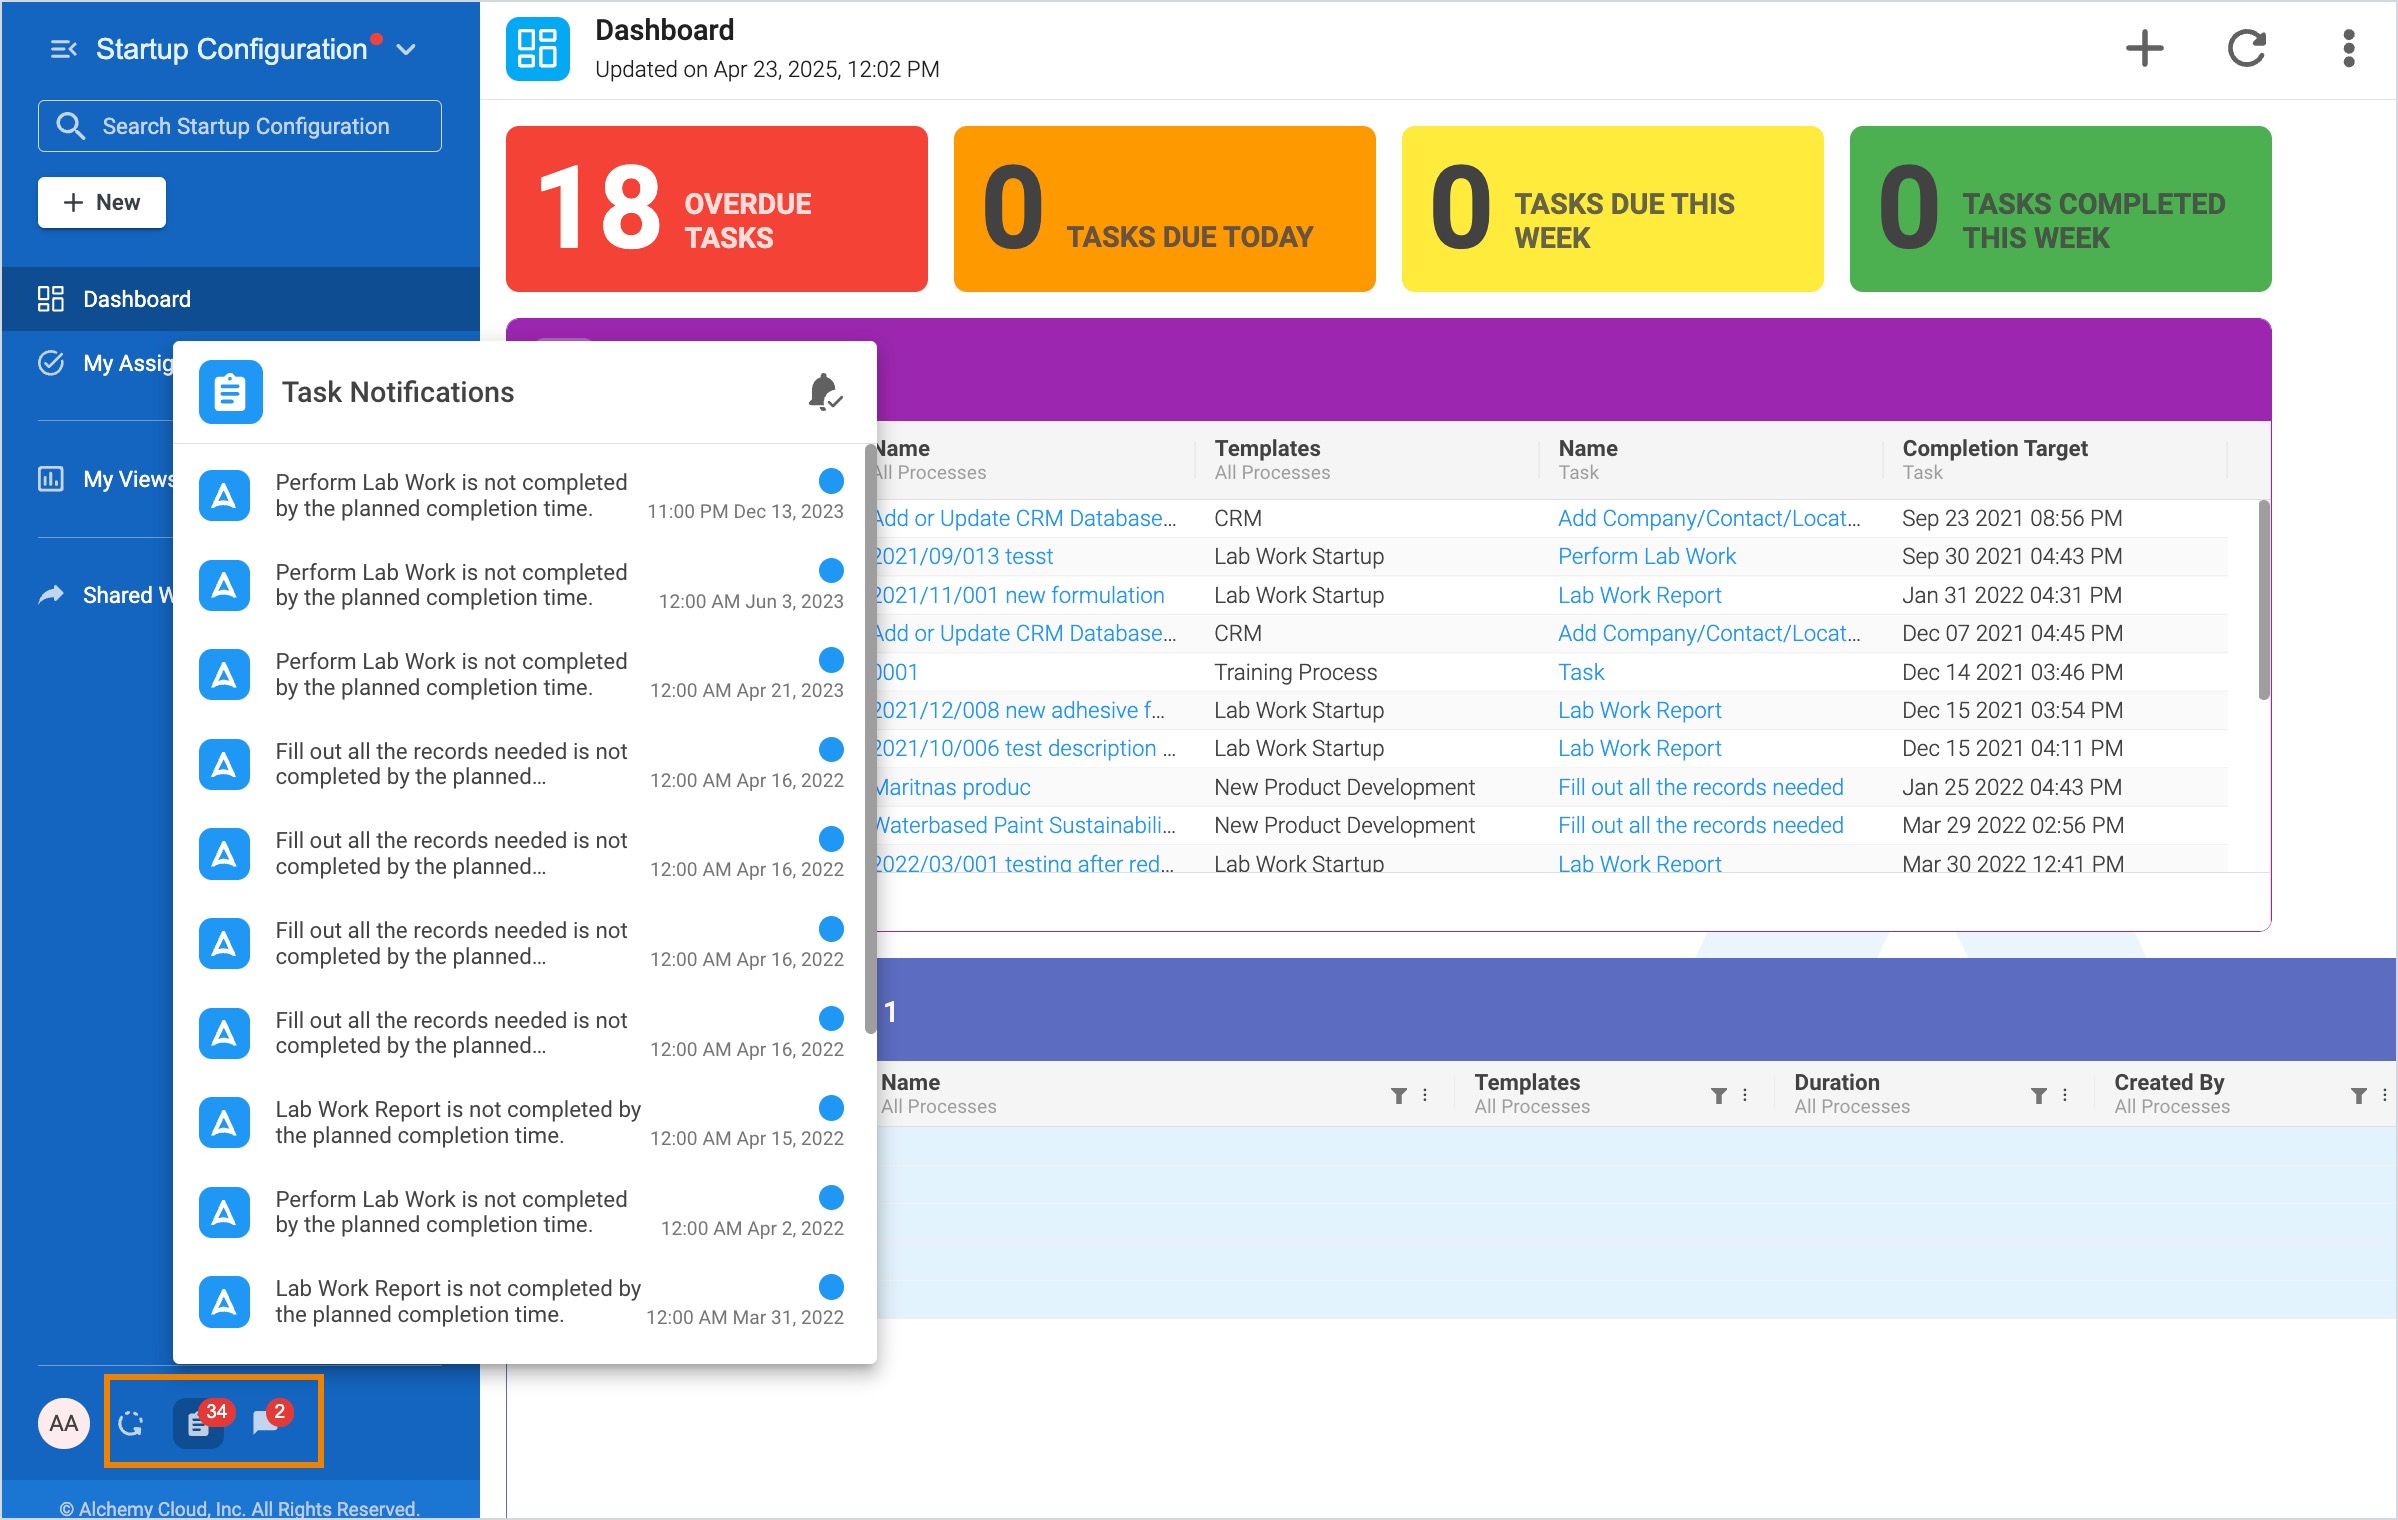
In the pop-up window, all notifications can be marked as read by clicking the bell icon with the checkmark, located in the top right corner. Additionally, notifications can be marked as read individually by clicking the blue circle at the end of each notification preview. Clicking this icon a second time will mark the notification as unread as well.
There are two types of notifications:
Built-In
Task assigned to me: This occurs when the system automatically assigns you a task or when a task has been assigned to you by another user. The displayed notification message will be: "System / [User Name] assigned [Task Subject] to you." Clicking the notification will lead you to the Process page where the task resides.
Configuration Defined
Various notifications set up by the System Administrator: The subject of the notification is also set up by the System Administrator. Clicking the notification will lead you to the Process page the notification is associated with.
Clicking the User Profile icon will display a small menu of where you can find the option for Notification Settings.

All settings will be enabled as a default but each setting can be disabled in the menu. Unless you turn them off, you will receive notifications for all processes, tasks, and comments in the app and via email.


Clicking the User Profile icon will display menu options for your profile. The icon will initially display the user initials until a photo has been uploaded in the menu.
Click on +Add Photo at the top of the menu to upload a profile photo. Supported formats include:
Supported sizes include:
You can update the photo at any time by uploading a new one. However, once a picture is uploaded it can only be replaced by another image; it cannot be removed.
We recommend that you upload a profile photo where your face is clearly visible and where you have a plain background in the photo if possible. This will allow better recognition between coworkers and clear visual understanding of who is assigned to a task or who has posted a comment etc.

In the User Profile menu, you can also see your name, surname, and Alchemy email. This data cannot be changed on the user portal. Contact your System Administrator to make changes in the Configuration Portal.
In Alchemy, all data is stored and presented in a structured way. Every process can consist of multiple stages between which different transitions are possible. Every stage consists of at least one record. At each stage, one or more tasks are assigned to users who need to finish some portion of the work to continue further in the process. The tasks are the means to progress in a certain process. The graphical representation of the data structure is represented in Figure 3.1.

A process page is accessed by clicking on any of the processes assigned to you in the My Assignments section. In Figure 3.2 you can see the sections of the Process page.
The Process page has the following features and information:

The Process navigation header has the following information and controls for the process you are in:

Figure 3.3 Process Navigation Header Overview

Figure 3.4 Process Menu
Note: Only users with the appropriate privileges will be able to set prioritization of processes. Contact your system administrator for more information.
To set or change the priority of a process, click the priority number under the process name or select Change Priority from the process menu.

A Process Prioritization modal will appear. The modal allows you to change the priority of any process in the list and not just the current process you are in. Users can drag-and-drop the processes to change the order of prioritization in the system by clicking the icon on the right side of each displayed card. Additionally, you users can double click on the priority number of a process and type in a different numerical value for quick reordering. When the priority of one process has been changed, the rest of the process priorities are recalculated.

The star icon to the right of the process name represents the follow or unfollow action. This action can be done manually by the user or automatically by the system.

If you click on the star, you will be following that process and will receive notifications related to it. When you manually choose to follow or unfollow a process, it cannot be overridden by automatic follow/unfollow action.
This option can be helpful when creating Views. For example, you can make a custom report that will contain all your followed processes, not only the ones you were assigned to, so you will be able to navigate to them quicker.
Here are the automatic follow/unfollow actions:
Note: Only users with the appropriate privileges will be able to put a process on hold or restart the process. Contact your system administrator for more information.
An On Hold process means the process has been “paused”. To put a process on hold, click the process menu icon and select Put on Hold from the list.

When you select Put On Hold (Figure 3.7), a pop up will appear providing details about this action, as seen in Figure 3.8.

The following actions will occur if a process is put on hold:
Clicking the PUT ON HOLD button in the modal will result in the process status changing from Active to On Hold and the process priority being removed from view.

An On Hold process can be restarted by selecting Restart Process from the process menu.

After clicking the RESTART button in the modal, the process will be resumed and its status will revert back to Active with a visible Priority number. The priority will, however, be the last number on the priority list just as it would if it had been created at that point.

Note: Processes that are in progress or active can be put on hold, however, processes that are voided or completed cannot be put on hold.
Note: Only users with the appropriate privileges will be able to void a process. Contact your system administrator for more information.
A voided process means the process has been “canceled” and cannot be reactivated. To void a process, click the process menu icon and select Void from the list.

When you select Void (Figure 3.12), a pop up will appear providing details about this action, as seen in Figure 3.13.

The following actions will occur if a process is voided:
After clicking the Void button, the status of the process is voided. The priority of the voided process is changed to N/A and is no longer visible in the Process header.

In the bottom section of the process menu are additional controls to view information about the process.
The Split View feature will allow you to work on 2 records simultaneously, or to enter data into one while looking at the data in another record. You can scroll through or select from the menu any two records placed in the current process. This feature is a useful tool for comparing two records that are far apart in a process.

To exit Split View, select Exit Spit View from the process menu.
The Plan view is a Gantt chart that enables users to see progress relative to the plan. It is an automated and universally understood way to communicate status.

A Planned Stage Completion Date and can be set for each stage of a project. This is the date when all work for this stage should be completed. Users can also set the Planned Stage Duration which is how long you expect the work to take during the stage.

Marked in the screenshot below you can see:

Marked in the screenshot below you can see:

Marked in the screenshot below you can see:

Marked in the screenshot below you can see:

The Flow view is used to see the process flow with all stages and transitions. Stages that are already completed are displayed as light blue, currently active stages are dark blue, and stages that have not been activated are white.

Clicking the Team view allows users to see all contributors for the process in a pop-up window. Contributors that are automatically added to the team are users who do any kind of action on the current process. Some examples of actions are:
All task assignees are also considered contributors. If you get unassigned from a task on a particular process and you did not complete any other actions, you will be removed from the team list.

The Files view opens a pop-up window that displays a list of all files that were uploaded to the process. When you click on a file, the main section of the window displays the following information:
From this panel, you can preview the files or download them. The preview of any image is opened in the modal window while all other file types are opened in a new tab window.
Users can see only the files attached to records on stages for which they have at least view privileges.

In Alchemy, every process is designed to follow a specific workflow constructed from stages as building blocks. Stages have different transitions between them, and those transitions follow a certain logic. Users progress through a process by completing tasks on each of these stages. With the task completion, you are announcing that a portion of the work is finished and that it can progress to the next stage.
All processes and stages are custom made according to your organization's needs. The processes are designed by mirroring your actual processes and procedures your company is complying with. Records that are inside stages represent forms or reports that users fill out and then store in archives.
By entering data in Alchemy you are enabling better usage of the valuable information that you are saving and allowing better analysis and continuous improvement capabilities.
The navigation panel can be collapsed by pressing the arrow icon in the top right corner of the panel.

This is useful if you would like to have more working space for the task or record areas. When the panel is collapsed you can see the arrow icon in the upper left corner of the record. Clicking this icon will expand the panel.

Stages in the navigation panel are represented as sections, with a status displayed under the stage name. Stages that are pending to be activated will not be visible in this navigation panel. However, you can always look at the process flow view explained in Chapter 3.2.5.3 - Flow.
To the right of the active stage name is a + icon. Clicking this icon will display a dropdown with two items that can be created:
An optional third item will show Compare if this feature is enabled for any record type in the configuration of the record template by the System Administrator.
Additional tasks can be created and added to the stage at any time as long as the process is in an Active status.
Note: Only users with the appropriate privileges will be able to add a task. Contact your system administrator for more information.
The task subject is displayed in the process navigation panel. If you are assigned to the process task, you will see your user profile icon to the right of the task subject.
Clicking on the task subject will display the task management area to the right of the process navigation panel, providing more information about the task and allowing further manipulation. More about tasks will be explained in Chapter 3.5 - Tasks.
Records are also visible in the process navigation panel. Any records created automatically when a stage is activated will be visible at all times. To the right of the active stage name is a + icon. Clicking this icon will display a dropdown with two items that can be created:
An optional third item will show Compare if this feature is enabled for any record type in the configuration of the record template by the System Administrator.
Note: Only users with the appropriate privileges will be able to add new records to the stage. Contact your system administrator for more information.
Once selected, a new record will appear in the process navigation panel in the stage it was added.
The order of the record types in the navigation panel is pre-set by the System Administrator but every record of the same type will be placed together and sorted alphabetically. If the maximum number of records configured for that stage is reached, the New Record control will not be available.
Records that have a red text status are invalid. This means that some required fields are not filled out or that something is not calculated correctly. The records that have a green text status are valid and completed as expected by the system.
Clicking the record name in the navigation panel will display the record page to the right of the panel.
Records are digital models of documents, spreadsheets, data input forms, and images your organization may collect in its natural flow of work. In a record, information is stored in a structured manner.
The Records area is the largest area on the Process page. By clicking on their names in the process navigation panel, you can easily move through records in different stages of the process.
The records area has the following features and information:

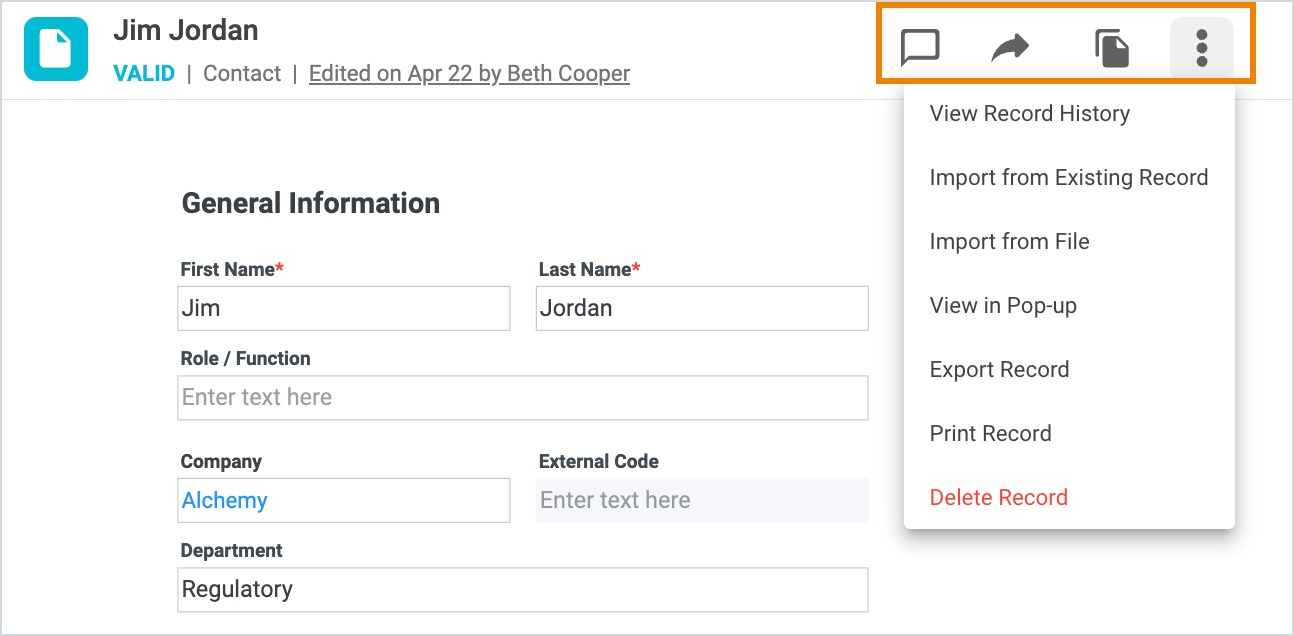
On the far right of the record area, you can see some additional icons and three dots that will have a drop-down menu with more actions.
The Record name is automatically generated when you reach a certain stage and the records are activated. In many cases, the Record name will be pulled from the value of the field in the record, after that value is entered or system-generated. The naming behavior is configured by the System Administrator as a naming pattern applicable for records. This pattern is formed according to your business owner's proposal and what is the most logical for your processes. However, the record name is editable by users with appropriate privileges.
You can edit the record name in these instances:
All of the above instances in which you can change the record name are possible if you have the appropriate view and edit privileges. You cannot change the record name if you only have view privileges.
You cannot change the record name when:
Every record needs to have a name. If a record name is deleted, the record becomes invalid and when the user hovers over the placeholder for the record name there will be a message, “Record name is required.”
The maximum number of characters for the record name is 80, with spaces.
When you are naming a record in a process remember that the record name needs to be unique for that Record Type on the process level. This means that there cannot be two records of the same type, with the same name in one process.
When you change the name of the record it will be updated in the process navigation panel as well.
Record fields make up the content of a record. The input fields can have different characteristics:
All of the aforementioned characteristics are customized in the Configuration Portal by the System Administrator. There is a lot of flexibility in the design of the records. The idea is that records closely resemble forms or the flow of your work and make it more user friendly.
Fields that have a red border and around them, and an asterisk next to the field name, are required and need to be filled in in order to proceed with the process.
When you are entering numbers in fields, they have a defined number of decimal places, and remember that the dot is used for indication of a decimal place.
On every Record, users can leave comments on any of the fields. By right-clicking on the field, a dropdown will appear.

If you select 'Insert Comment' the field will get a light yellow highlight with a pop up for entering a comment. In the comment section, you can @mention or +mention a fellow Alchemy user and they will get a notification that you've left them a comment.

Once a comment has been left on a record the Comments icon will have a red dot that indicates there are unresolved Comments.
By clicking on the Comments icon, a list of all Comments is visible in chronological order.

Comments can be Resolved and Re-Opened. Fields with active, unresolved comments are visually marked in yellow, so you can easily identify which have comments. Specifically, when you move away from the Field with the Comment, you will notice a yellow highlight line on the right side of the field indicating that there are one or more Comments on that field.
Records that are dedicated to a stage can be set to open automatically when you reach the stage. This is set by the System Administrator in the configuration portal. Usually, these records are somewhat mandatory in terms that they represent your standard way of working. However, some records, which may provide more relevant information for that stage, can be added manually. You can also add records manually if you need more versions of the same record template, already created automatically or manually.

When you add records to a stage they will be added to the bottom of the list in the process navigation panel and a new record will be visible in the record area.
When the Admin is configuring Alchemy according to your organization's needs, he has to define the minimum and maximum number of records for each stage. Records can be in different templates which we call Record Templates. For example the Formulation record has the same layout (template) of fields whenever it is added. For each of those templates the admin needs to define the minimum and maximum number for each stage. These minimum and maximum values can be calculated as formulas. If you haven't done something correctly, warning messages will appear.
You can add records to a stage when:
You cannot add records to a stage when:
In order to be able to share records with external users, please contact your Admin to enable this feature for the records needed. This is not enabled by default.
To share a record, click on the Share icon in the upper right corner of the record.

A pop-up window will appear with details for the record you wish to share. To add people, enter their email addresses in the “Invite people” field.
Clicking the “eye” icon, you can set the recipient(s) privilege. The recipient can “edit” the record directly themselves or can only view the shared record, based on the privilege you select.
Finally, you can type a short note to the recipient(s) to accompany the information just like you would in an email.

When you've added the email addresses, they will appear in the 'Shared with' section of the modal.
Please note that a shared, editable record can have an expiration date so that the link does not stay open and changeable indefinitely. If you hover over the email you can see additional options:
To set the expiration date click on the clock icon and select the date when the link to this shared record will expire.

People you have shared the record with will get an email with the link to that record. They can click on the “OPEN IN ALCHEMY” button to view or edit the shared record.

The icon that looks like a text bubble indicates the information about comments on that record. This icon has three versions depending on the status of the comment in the record.
An empty comment icon means that there are no comments on the record:

A comment icon with a red dot means there are un-resolved comments in the record:

A comment icon with a checkmark means all comments in the record have been resolved:

If you click the clone icon a replica of that record will be created:

The possibility to clone a record will vary from record to record depending on the configuration by the System Administrator.
The record history is a historical overview of changes in the record. It includes real-time, updated information including:
Note: Only users with View and Edit privileges will be able to see the edit history of a record.

You do not always need to enter all data from scratch. If you have a record that you can use as a starting point (i.e., a formulation table, where you only want to change a few of the ingredient amounts) you can import the data from one existing record to another.
You can do so by clicking on the Additional Record Options icon in the top right corner of the record and selecting the Import From Existing Record option. You will then be able to select from a list of matching records with the same template. You can find the record by searching its name, and by clicking on it you will be able to preview the data.

After you find the record, you can import it by clicking on the import button. You will be able to choose between two options by checking the box in the modal that appears:

Overwriting the data will result in all of the editable fields in your record to be replaced with the data from the same fields of the record you are importing. This means that the data the user has entered so far will be overwritten.
Choosing not to overwrite the data, by leaving the box unchecked, means that the data from the imported record will only be written in empty fields where there is no data. If you choose not to overwrite when importing from an existing record, all checkboxes in your record will keep their previous value, even if they have a different value in the record you chose for import.
You can also import the data from a .csv file (comma-separated values file), stored on your computer. You can do so by selecting the Import From File option. This will open a modal where you can:

The imported file needs to be in the right format. That can be ensured by downloading it from the import modal. The first row of the file contains field identifiers, which are used by the system to find each field. Keep in mind that some of the fields cannot be imported from a file, such as record references, calculated fields, etc. These fields will not be in the columns in the created import file template. You can enter (or paste) your data in row 2 and below.
For fields that are single (i.e not part of a table) you should enter only data in the second row of the file. For fields in tables, you can enter data in multiple rows (row 2 and above), each row entered will correspond to one row of data that will be imported in Alchemy.
When the file is downloaded as .csv and then opened in excel for entering data, all data in the first row of the downloaded file must remain unchanged. Labels that are presented in the first row are field identifiers and are used for the system to know in which fields to import the values you enter. You can, however, reorder columns, or delete the ones that you do not want to fill in from the file.
Once you have the .csv file in the correct format, import it by selecting Import and finding the file on your device. Importing data from a file will always overwrite the existing data in the record.
This option gives you the ability to view the record in a pop-up window rather than a full screen view. This allows you to position multiple records on your screen in one window, for easier viewing.
This option allows you to export the data from the record in Alchemy to a .csv file. Simply click on the option from the Additional Record Options dropdown and select where on your computer you want to save your file.
Selecting Print Record from the Additional Record Options dropdown will open the print modal from Chrome where you can print the record or save it as a PDF. By default, all fields in your record will be on the printout, however, you can contact your System Administrator to discuss the configuration or if you want your print preview to look different.
The last option is to Delete the record. A confirmation modal will appear asking whether you are sure you would like to delete the record. Click DELETE if you want to delete that record and CANCEL if you would like to cancel this action.

You will be able to delete records if:
When you delete a record, it will disappear from the process navigation panel and the record viewing area.
The COMPARE feature is something that needs to be enabled in Alchemy’s configuration portal by the System Administrator. Compare can be enabled for each record template inside a process. Once set up, the COMPARE feature is accessed by clicking the + icon to the right of the stage name. You will get a drop-down of records that can be viewed in the COMPARE feature.
Once selected, a Compare view will appear in the process navigation panel and the tools to display a Compare table will be shown in the main pane.

To import existing records into the view, click the Manage Records icon and select ‘Add Existing Record’ from the list.

A new window will appear, listing previously created records of the selected type that you can pull into the Compare view. After selecting the record, click the Add button in the bottom right corner.

Repeat this action until you pull all relevant records that you wish to compare.
Records from different processes can be pulled into a COMPARE view when adding existing records to the table. When you pull them into the Compare view, the column header will have a lock icon.

The lock prevents you from changing historical records. If edits need to be made, you can clone the record in the compare view. (See the section above called 'Clone Record' for more detail and pictures showing how to do this.)
The lock feature, together with clone and edit, will keep your superset of records clean, searchable, and reusable in subsequent projects.
To start building out a COMPARE view for a project, specific fields from the selected records can be chosen to line up side by side. Click the Manage Fields icon to display a list of fields to be displayed from the selected records.

By default, the COMPARE view is grouped by Rows. Click the dropdown next to the text ‘Grouped By’ to display additional options. Options displayed vary based on the records and fields selected in the view.

Depending on which fields were selected to be compared, grouping can be done by any of those fields.
Records that are in the COMPARE view can be cloned. This means that a copy of the original record will be made and be visible both in the process navigation panel, as well as being displayed in a new column in the COMPARE view.
To clone a record, hover the mouse over the header of the record you wish to clone to display the menu options icon. Click the icon to display a list of options and select Clone Record from the list.

In the COMPARE view, data in unlocked records can be edited. All the information that is changed in the Compare view is immediately changed in the underlying individual record as well. In the event the record is locked, a lock icon will be displayed to the left of the column header name. To make edits to a locked record, a clone of that record must be made and edits can take place in the cloned record.
Any of the records in COMPARE view can be highlighted with a color to be more easily identified. To highlight a record, hover the mouse over the header of the record you wish to highlight to display the menu options icon. Click the icon to display a list of options and select Highlight Record from the list. A palette of color options will appear for you to choose from.

Sometimes it is important to be able to reorder your columns of data. Records can be reordered by simply dragging them across columns. To move a record, hover the mouse over the header of the record you wish to move to display the Reorder Record icon. Click the icon and drag the record to the desired location in the view.

Our standard collaboration features in the form of comments, @mentions, and comment resolution are also available in the COMPARE view as shown below. Right click on any field in the view to access the ability to add a comment.

A comment is a particularly useful way to highlight to yourself or a colleague something specific that you notice in a particular field.
A Compare view can be displayed in three ways:
Default mode lists all fields without any indicators to suggest there are differences between the records displayed.
Highlight mode uses the first displayed record as the standard and bolds the text of all other records in fields where there are differences from the first record.

Delta mode highlights the difference between numerical values from the first record to all subsequent records displayed.

By finishing tasks in Alchemy you are progressing through the records and stages of any active process. Each stage needs to have at least one task related to the relevant work in that stage. When this task is finished you can continue to the next stage. If there are multiple tasks in a given stage, it is necessary to finish all of them to proceed to the next stage.
A task displays in the same manner as a record inside a process. Clicking the task in the process navigation panel displays the task in the records area in the main panel of the screen. The task details displayed has the following features and information:

The task subject and description can be generated automatically. The System Administrator can configure the subject and description for mandatory tasks at every stage. The subject and description of tasks can contain patterns, information from different fields inside records, or any other information that will be logical to you, as long as they are not generic and the same as in a previous task in the process.
The task subject can contain 80 characters, including spaces. If you exceed the number of allowed characters a warning message will be displayed. For the task description, the maximum number of allowed characters is 3000, otherwise, a warning message will appear.
The Score field can represent the complexity of the task but it can have other meanings depending on your organization's needs, as it is not a required field. It cannot be a negative number and must be a whole number with values from 0 to 1000.
Task dates are important for keeping track of deadlines. Date and time stamps include: Planned Start, Due Date, Started, and Completed.
The Planned Start date marks the expected start of work on the task. By default, this date and time are set to when the task was created. It can also be set as in the future or the past (it can be before the stage activation date), but it cannot be after the Due Date.
Due Date marks the expected deadline of the task. If the task is created during stage duration, then by default Due Date is set as the end of the expected stage duration. Stage durations are set up by the System Administrator in the configuration portal. If the task is created after stage duration has passed, then by default the Due Date field is empty and needs to be set manually. Due Date cannot be before the Planned Start.
If the Due Date is missed, the field title will turn red to indicate that the deadline is missed for that task. You can choose to change the Due Date and complete your task after that or complete the task without changing the date. Regardless, you will be able to move forward in the process.
Started and Completed dates are calculated by the system and cannot be set manually. The Started date will be the exact date when you click Mark Task as Doing and change the task status. The moment you press the Complete button the Completed field will be filled with the exact date and time when you have finished the task.
If you skip the Mark Task as Doing status of the task and just click Complete, the Started date field will not be calculated. It will be left blank and the Completed date will just be shown.
In the Assignee area, you can see the current users that are assigned to a task. If you have the appropriate privileges, you can assign one or more users to a task by clicking on the button + Assignee.
To remove the assigned user from a task, hover over the name or the profile icon and an X control will appear. By clicking it you will remove the user from the task.
The Effort Spent on a task represents the number of hours and minutes spent on a particular task. By default, it is not a required field but it can be set as required by the System Administrator in the configuration portal.
If the effort spent is configured as required, the task and stage cannot be completed if the effort is not logged and the effort must be larger than zero. The Effort can be added, edited, or deleted on tasks in any status on both automatically generated or manually created tasks.
Effort Spent can be entered, edited, and deleted by users who are assigned to the task but also by users who are not assigned to the task and have the appropriate view and edit privileges for that stage. Keep in mind that you can add, edit, and delete only your efforts and not those of other users. Users with the stage privilege view cannot log effort or delete the Effort Spent.
Some situations that may prevent the finishing of the task are:
These situations need to be avoided for the tasks on stages that need to be completed. In the event you try to complete a task, if any of the 4 scenarios are true, you would get an error message like in Figure 3.55 (or a combination of them)

Users can attach multiple files by selecting the files that they want to attach in Alchemy. The files can be selected and then dragged and dropped into the pop up window or chosen from the device. This will allow much faster manipulation of files and speed up your work. Upload of multiple files needs to be configured on the Configuration Portal by the System Administrator.
Editing of photos can be easily performed, eliminating the need to crop or rotate images before uploading them to Alchemy.
Attachment fields have a blue square icon with a + symbol. By pressing that button a pop up window will appear.

Files can be dragged and dropped, taken by the device camera, or imported from a device folder.
If you select 'My Device' a modal will appear for you to choose files. You can select multiple files by holding the Ctrl key and clicking on the files. The second option, 'Camera,' is possible if your device has a camera. In that case you have the possibility to take a photo on the spot or record a video.
When you select the files and click 'Open' the modal will look as in the image below. Click the blue 'Upload 3 files' button.

When the files are uploaded they are stacked next to each other:

Editing files can be accessed by clicking the pencil icon in line with the image name.

The next screen allows you to change the file name. For image files, an additional option to select an Edit Image button is available.

Clicking the Edit Image button gives you additional options to edit an image before upload, including: rotate, flip the image, crop, zoom in or out. To save any changes made in this view, click the Save button in the upper right corner.

Alchemy’s image annotation feature lets you add text labels and shapes to images to highlight areas of interest or provide visual context.

Getting Started
To annotate an image:
Adding Annotations

Editing Annotations
Finishing Up
When you're done annotating, click the back arrow (←) at the top to return to the standard image view. All changes will be saved automatically.
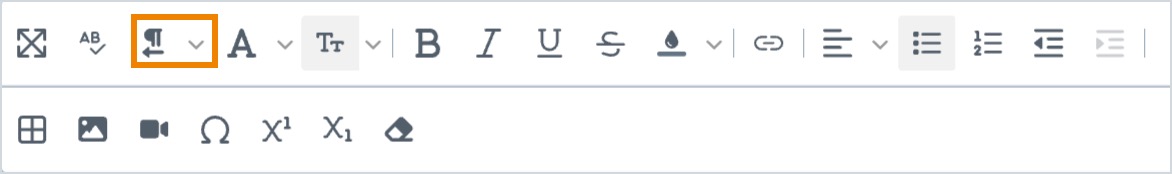
The rich text editor can be found in any large free-text field, such as Objectives or Observations. It has a variety of features and can be used to enhance the field input. Features include:

Users can click the expand screen icon to expand the view of the field to the entire screen, allowing for a larger working interface while they complete the field.

Use spell check to ensure accuracy in the text being displayed in the field before finalizing a section of your record.

Stylize your text by determining which format it should take in the field. Choose between options:
Customize displayed text by selecting a font type from the dropdown menu.

Customize displayed text by selecting a font size from the dropdown menu.

Further customize displayed text by selecting from options to make text:

Choose a color from the color palette to display text, or the background color, to differentiate between important values.

Insert a link into the field by providing a valid URL. Display the link in text format and choose to enable the option to open the link in a new tab.

Adjust paragraph alignment with options that include:

Add lists to the displayed text through bulleted or numbered lists.

When writing text with multiple paragraphs, increase or decrease indents to display the difference between text.

Add tables to the field by selecting the icon and choosing the dimensions of cells to add to the field. The table will span the width of the field when displayed.

Insert media into a field to provide a visual representation of the text being displayed. Options include the ability to add:
Images can be uploaded from your device or linked using a URL. Once inserted, an image can be edited further through alignment, dimensions and image properties. Click on the image to see these additional options.
Videos can also be linked or embedded directly into the field.

Users can enter special characters into the field by clicking this icon. A modal of all special characters will appear and can be selected from.

Use these functions to write mathematical formulas or chemical compounds directly into a field.

While using any of the other icons to alter text in the field, if you want to revert specific changes you can highlight the portion of the text and click the eraser icon. This will revert the text back to its original state.

Records can be configured by your System Administrator to incorporate tables for users to capture data in a structured manner. While completing the record, users can use the assistance of keyboard shortcuts to make data entry simple and efficient.
To move across rows, use the Tab key to move the cursor from one cell to the next.
Users can also use the arrow keys to navigate to a specific cell in the table to enter data, making the mouse obsolete while in this portion of the record.
Users can enable keyboard shortcuts to copy and paste values from one cell to another. To paste into multiple cells, use the mouse to multi-select cells and press cmd + C on the keyboard. Navigate to the starting cell in the row you wish to enter the data and press cmd + V to paste the values.
In the trials table users can also utilize the feature, Import to Actual, pasting all theoretical values into the actual values column. Click the icon in the right corner of the Actual header to display a confirmation modal.
Note: If you choose to select Import and have any existing values in the Actual column, these values will be overwritten by the imported theoretical values.

Each user in Alchemy can access and analyze data by creating unlimited custom Views. The views are unique for each user.
In Alchemy all data is stored and presented in a structured way. A process can consist of multiple stages between which different transitions are possible. Every stage consists of at least one or more records. Records have fields that contain data filled in by the users and/or the system. Fields can also be used to create a connection between two records, using record references, as shown in Figure 4.1, represented by blue fields and their relevant connections to records. They serve as connection points that allow the data in Alchemy to be interconnected.

Furthermore, on each stage, one or more tasks are assigned to users who need to finish some portion of the work to continue further in the process, which can also be accessed in a view.
Data in Alchemy can be divided into two main groups: System Data and User Data.
Data automatically generated by Alchemy, which may or may not be immediately visible to the user. Examples are the dates when a process is created and completed, who created a process, etc.
This is what users in Alchemy enter while using the system. In most cases, these are the values entered in fields on records, created records (i.e. raw materials), details of a task, etc.
To make a view, you will use Alchemy's graphical interface which allows you to quickly and easily pull data from the Alchemy database. To start, click on the + icon to the right of the My Views subsection in the system navigation panel.

The initial View setup page will appear as shown in Figure 4.3 below:

Select the Starting Data from the dropdown. This will populate the view with the data column, Name, for the selected starting data and allow you to:

Accessing your Views is easy since they are represented as Menu Items in the system navigation panel. Views can also be rearranged by drag-and-drop within the subsections displayed in the panel.

As you can see in the image below, the data in the View listed under each column header can be searched by typing keywords in the search bar. This way the data shown is narrowed according to the search criteria. Furthermore, it's noted how many results are available in the lower left corner of the View.

The specific columns of data that are visible can be selected by clicking on the + icon in the right corner of the View, or by clicking the Columns icon/label and clicking the Add Columns button. This will open the Add/Remove Columns panel on the right side of the display.
Users can then select from the applicable options to determine which data they want to be visible in the View.

Additional filters can be applied to the View through the Filters icon. This will display an Advanced Filters modal where filters can be defined and applied.

With Advanced Search, all the existing columns can be filtered according to desired values, ranges, etc. After the filtering is done, users click the ‘Apply’ button and the View will be filtered down according to the entered criteria.
Use the Group By feature to group data based on one or more of the visible columns in the View. Click the Group By icon/label and select the column from the dropdown list. Multiple groups can be added. To add additional groupings, click the + Add Group button in the top right corner of the extended panel.

Add visualizations to enhance your displayed data. Click the Visualization icon/label to display a panel on the right side of the screen.

Click the + Add Visualization button and select the desired chart type from the dropdown menu. Chart types include:
Rename your visualization by clicking the ‘Untitled’ text field in the upper left corner of the display and entering in a name for your chart.
The Area Chart gives a visual representation of quantitative data and it is commonly used for comparison between different quantities.
Choose Area as the chart type. Select Series 1 data, which will be represented on the Y-axis and data to be placed on the X-axis.

Click the + Add Series button to add more than one series.

Click the drop-down menu below Stacking and choose the option, Stacked. Areas are not overlapping if this option is chosen.

Choose Bar Chart as the chart type to compare data across categories. Select Series 1 data, choose data for the X-axis, and select the chart orientation.

Click the + Add Series button to include additional series and select the data for each.
Choose Bubble as the chart type. Select Series 1 data, bubble size and X-axis data to categorize the series.

Hover over the bubble to display the results in a tooltip.
Choose Doughnut as the chart type. Select the data series and category by which the series will be sliced.

Hovering over a section of the chart shows the value of the slice in a tooltip.
Choose Histogram as the chart type to show data distribution. Select the series of data and category by which the series will be displayed.

Hover over the specific bar to display the frequency of data points in the bar interval.
Choose Line Chart as the chart type to display trends over a period of time. Select the series of data and X-axis data.

Click the + Add Series button to add more than one line and visually compare the data.

Hover over the line to show the results for each data point placed on the X-axis.
Choose Pie as the chart type to show proportions of the data. Select the data series and category by which the series will be sliced.

Hover over the slice to show its value in a tooltip.
Scatter plots are used to observe the relationship and investigate correlation between two different numeric variables. Choose Scatter as the chart type. Select the Series 1 data and X-axis data.

Hover over a dot to display its value.
Use this two-dimensional chart when you want to plot one or more series of data across several unique dimensions.
Choose Spider as the chart type. Within the Select Categories section click on the arrow inside the category field to choose the specific category. Select at least two categories. Within the Select Series section click on the arrow inside the series field to select the appropriate data series.

Return to the Data view and visualization panel by clicking the blue back arrow under the visualization name. For each chart, you can choose to Expand, Edit, Download (as a .png image) or Delete the chart.

Once your data view has been set, additional views can be added as a way to visualize and parse your data further. Additional views include:
Using a grid is a way of sorting the desired data in the form of groups and subgroups. Each group is a branch which can be expanded to show subgroups.
To add a grid view, click the + icon next to the Data tab to display a dropdown with various visualization options and select Grid.

The grid opens in a separate tab. Double click on the tab name to rename the chart. On the right side are options, Columns and Filters, to help manage the grid.

Click Columns to display a list of columns available in the grid. Check or uncheck boxes next to column names to determine whether they are displayed in the view. Use the icon to the right of the checkbox to drag and drop columns to determine the order in which they appear.
Columns can also be dragged into the Row Groups section for further sorting of the grid.

Drag and drop a column in the Values section to sum the values of that specific column by its row group. Summed values will be shown in the grid.

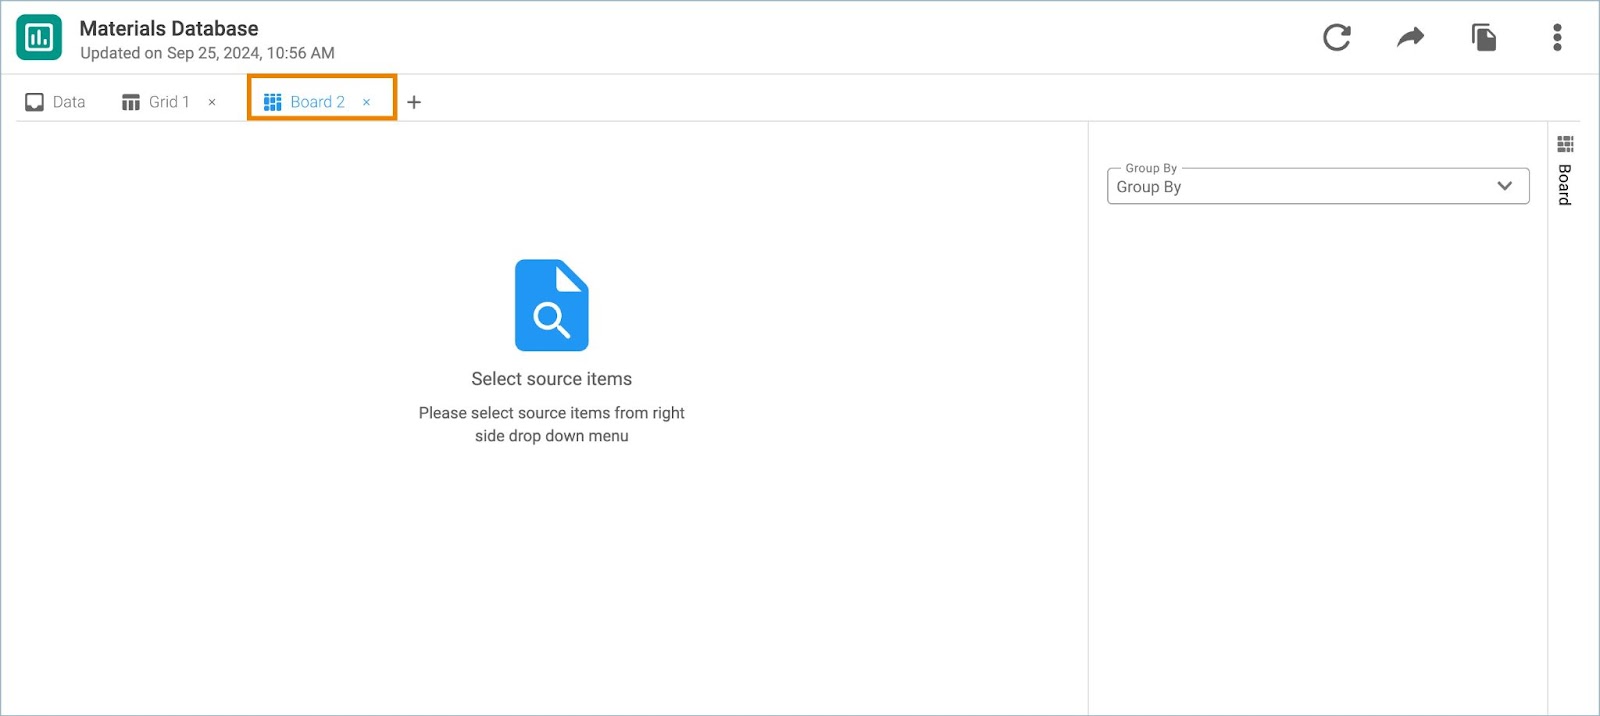
A board is another way of showing the data in the View. Data will be displayed grouped according to the chosen criteria. Groups are displayed in a form of scroll-through boards.
To create a board, click the + icon next to the Data tab to display a dropdown with various visualization options and select Board.

The board settings window opens in a separate tab. Double click on the tab name to rename the board and select a field value under Group By.
Use Sort By to further sort a specific board.

To add a scatter plot, click the + icon next to the Data tab to display a dropdown with various visualization options and select Scatter.

The chart settings window opens in a separate tab. Double click on the tab name to rename the chart. Select the data values to be shown on the X and Y-axis. Click Add Series to put additional data on the Y-axis.

Click Show Regression Line and select its type from the dropdown menu that becomes visible. Then choose the shape, color and size of the data points, as well as the line type.

Select Split By to split displayed data and select the variable from the dropdown menu that becomes visible.

Click More Options to display additional fields under the X and Y-axis sections of the Chart Settings. After entering labels for each axis, choose the type (Linear or Logarithmic) and define minimum and maximum values.

To create a Bar Chart, click the + icon next to the Data tab to display a dropdown with various visualization options and select Bar.
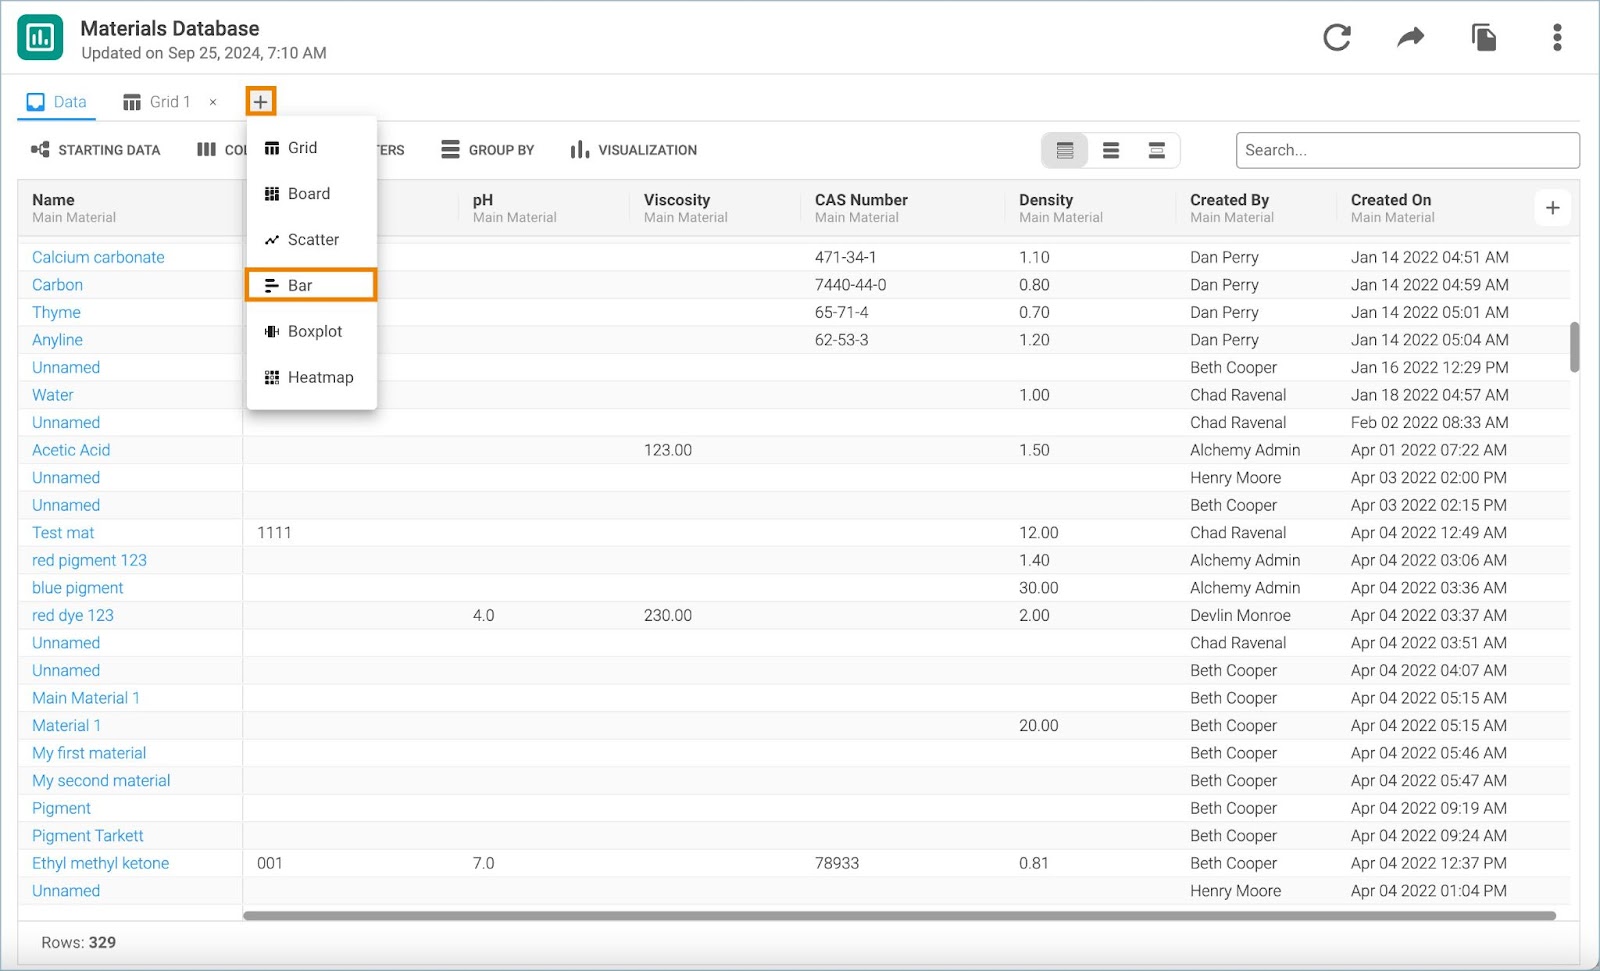
Figure 4.33 Add Bar Chart
The chart settings window opens in a separate tab. Double click on the tab name to rename the chart. Select the data to be shown on X and Y-axis.

Figure 4.34 Manage Bar Chart
Check Aggregate under the Y-axis to aggregate the data in the bar chart. Click on the arrow inside the Aggregation field to choose the function according to which the data will be aggregated.

Click Add Series to put additional data in the bar chart. Each series will be shown in a different color. A legend of colors is displayed below the chart. Click on the color legend to omit a specific series from the chart. Click the series again to include it. Click the series menu icon to remove an unwanted series of data.

Click More Options to open additional chart settings. Options include choosing chart orientation and bar stacking options, displaying bar values on the chart, and manually entering axis labels. Create a stacked bar chart to show different numeric values across multiple data categories. Each bar is divided to the sub-segments, which are stacked together, thus the total value of each category is split into parts. You can also change the color for each series of displayed data.
A boxplot shows the distribution of numerical data and its skew by displaying the data quartiles.
To add a boxplot, click the + icon next to the Data tab to display a dropdown with various visualization options and select Boxplot.

The chart settings window opens in a separate tab. Double click on the tab name to rename the chart. Select the data that will be displayed in the boxplot. Click Add Series to add more series of data.

Additional series will be displayed in separate boxplots. Click the series menu icon next to the Series label to remove the undesired series from the plot. Hover over the boxplot to see the data distribution per quartiles (Q1, Q2, Q3, Q4). Dots that are not included in the plot are representing outliers. Hover over dots to check their values.

A heatmap is a two-dimensional representation of data, where rows and columns are denoting different sets of data. Heatmaps are used to correlate a series of data in the View.
To add a heatmap, click the + icon next to the Data tab to display a dropdown with various visualization options and select Heatmap.

The chart settings window opens in a separate tab. Double click on the tab name to rename the chart. Choose the data which will be displayed in the heatmap for Series 1.

Click Add Series to add data for correlation. Click the series menu icon to remove the undesired series of data from the Heatmap.
Note: If a record reference field is added, select the Transform Field variable and the Grouped By value.
The legend is placed on the right side of the Heatmap. Correlation coefficients equal to 1 indicate direct positive correlation, while -1 is indicating strong negative correlation. If there is no correlation between the variables the correlation coefficient will be 0.
Note: Empty fields in the heatmap indicate missing data.

If you have any questions or suggestions, our Customer Success team is always available to assist you. Feel free to contact us at cs@alchemy.cloud or contact your designated Customer Success Manager!