We are excited to be launching the following new features on the Alchemy platform.
Task Management
Tasks now have their own link in the left nav and their own standalone page in the platform, so you have an overview of all the work on your docket.
The most critical information is immediately viewable on each Task “card”:
- task subject
- company
- contact or project to which the task is associated
- to whom is it assigned
- scheduled start date and due date
- task status
Making it easy to tell what needs to get done and in what order with just a quick scan of the Task cards. You can click right in to start your work which can range from running a test to calling a customer to requesting feedback on a trial.
The primary action for the Task is directly clickable on the card and other actions are accessible by clicking the 3 dots.

On the Tasks page you can view Tasks as a list or in a Kanban board which is a great way to see to do’s, work in process, and what got done.


You can see Tasks assigned to you and by you and filter and sort by several criteria so you can zero in on exactly what you want to see.
- Tasks Assigned To Me
- Tasks Assigned By Me
- Filter by Company associated with the task
- Filter by Task Status
- Sort by Due Date, Start Date, Subject, and Task Type

File preview for Images and PDFs
No matter how hard people try to have adequately descriptive names for their files, sometimes a picture is worth a thousand words. You can now automatically see a preview of the images and PDFs you upload to the project, so you don’t need to click in and download to figure out what is there.

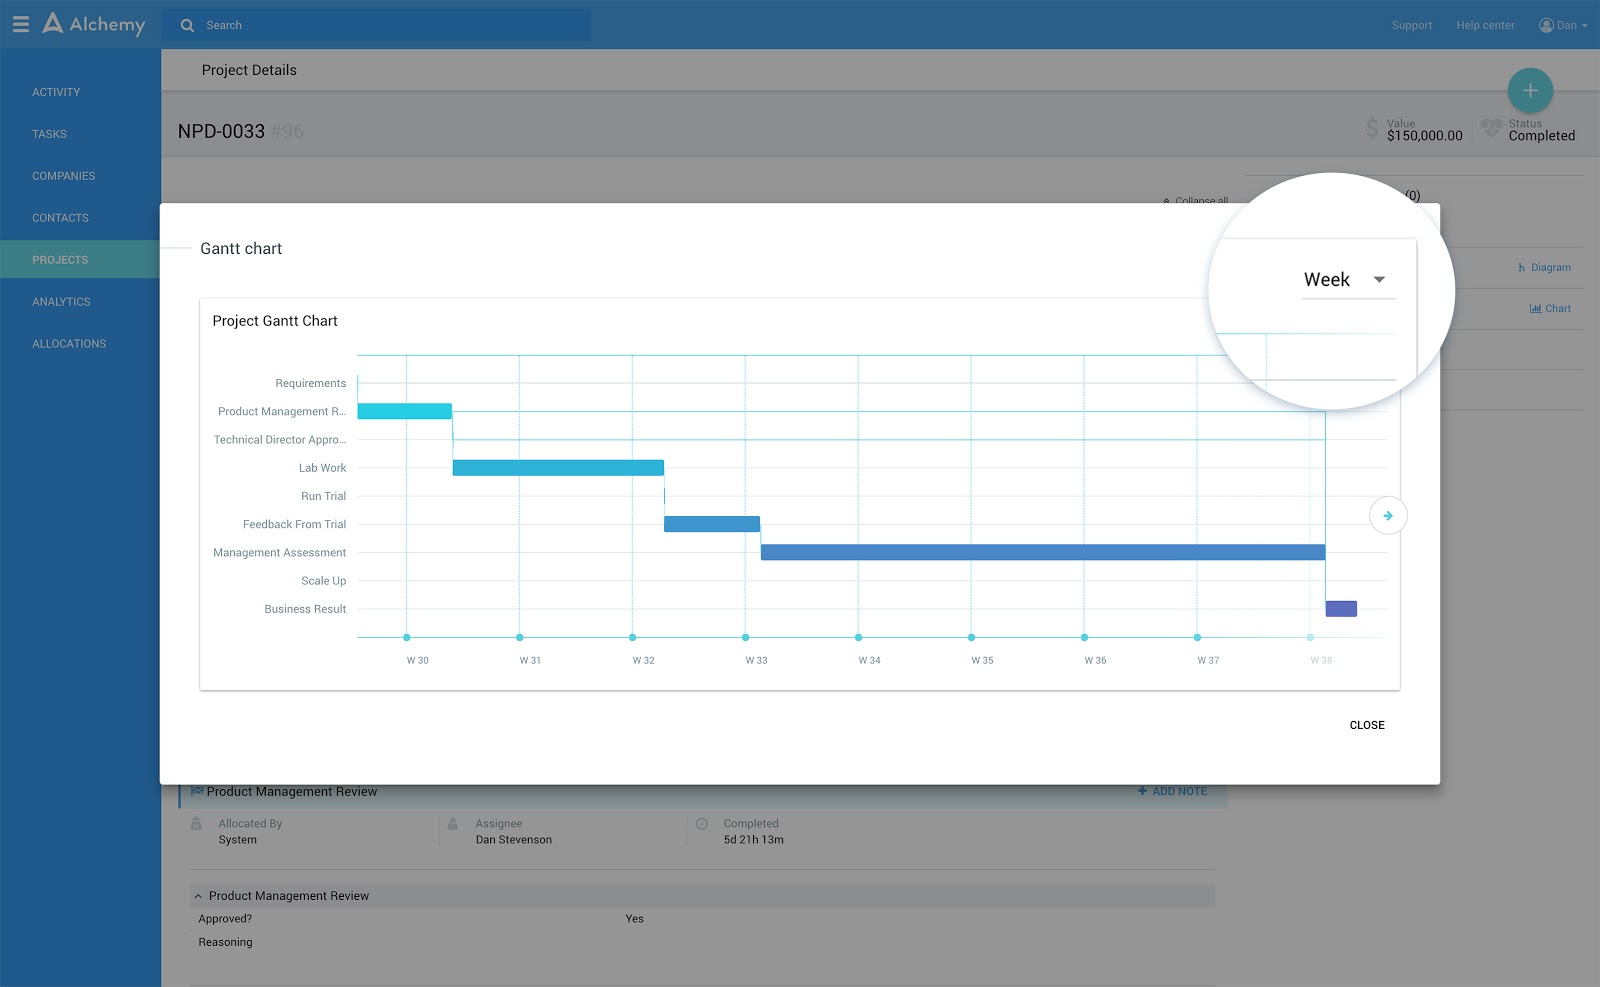
Automatic Gantt Chart Generation
Gantt charts used to be painful and time consuming to create. Now, Alchemy will automatically generate a visual overview of every ongoing and completed step of your project and how long it took in a gantt chart, so you don’t have to. Adjust the time scale for long or short projects at the click of a button.