New Features
1. Views (i.e., Reports) Upgrade
2. Record Sharing Outside Your Alchemy User Base
3. Project Planning & Gantt Charts
4. New Functions - LOG & DATE FORMAT
1. Views (i.e., Reports) Upgrade
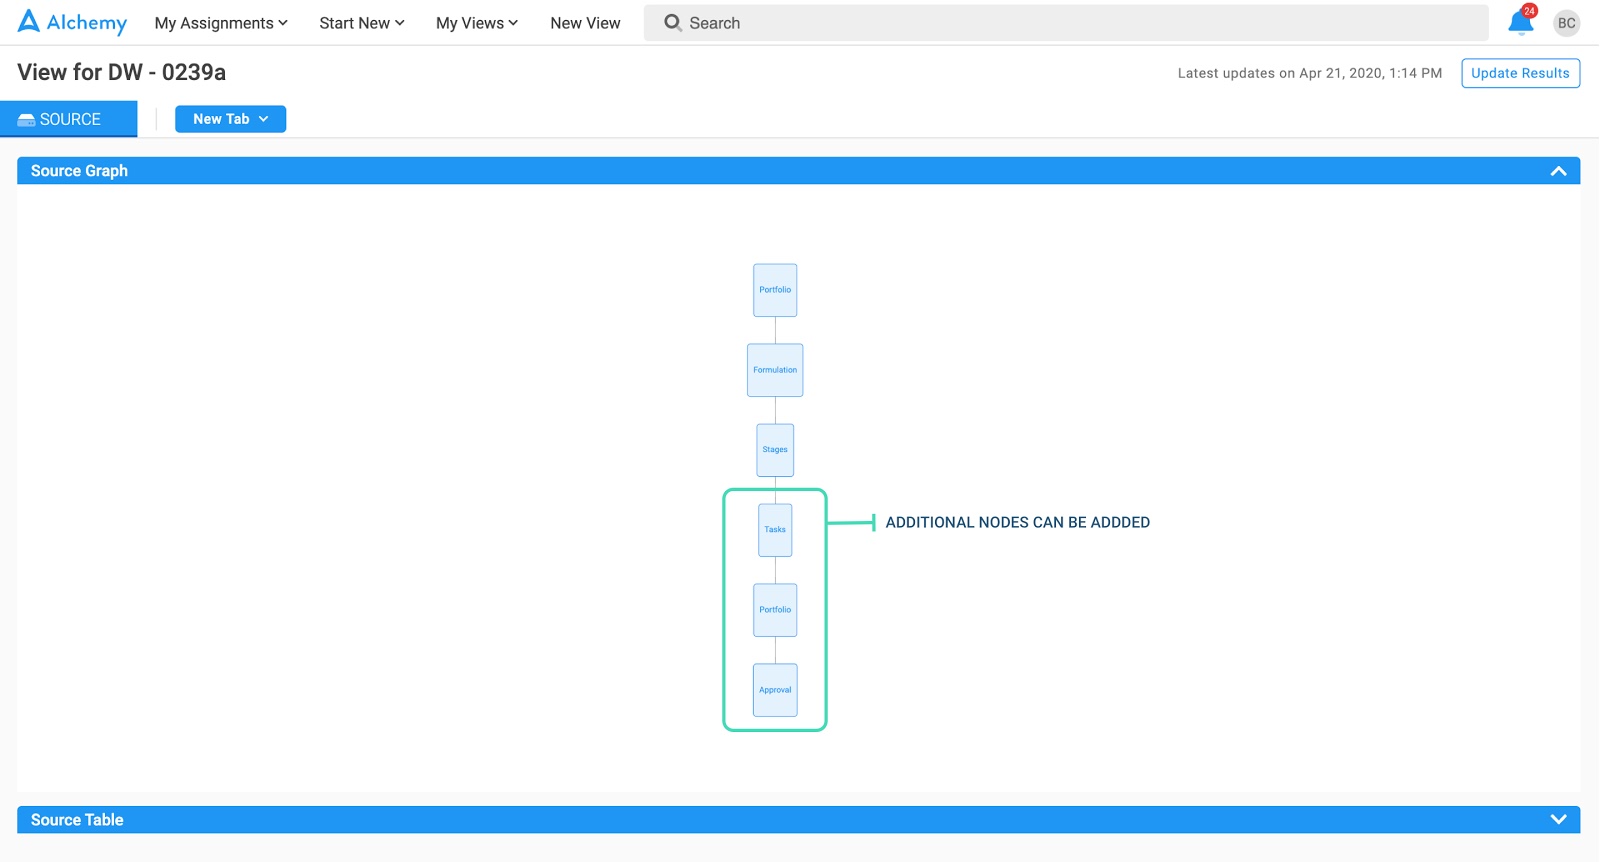
The number and type of data “node” connections have been increased so you can build more sophisticated reports.
Key Benefits
Leveraging and analyzing the various types of data collected in Alchemy by creating views (i.e., reports) is a major benefit of Alchemy. In this update we are extending how the information saved in processes and records can be linked together to create even more powerful views. Now, users can pull data from anything that is connected to anything else in their dependency network (nodes at the Record and/or Process level). Specifically, you can pull data points from records in 2 or more related processes into a single view. These Records can have first order connections (i.e., direct connections), second order or even n order connections (i.e., indirect connections).
With this feature, you can now continue to build on your view even after you've connected 3 nodes. As shown in the picture below:
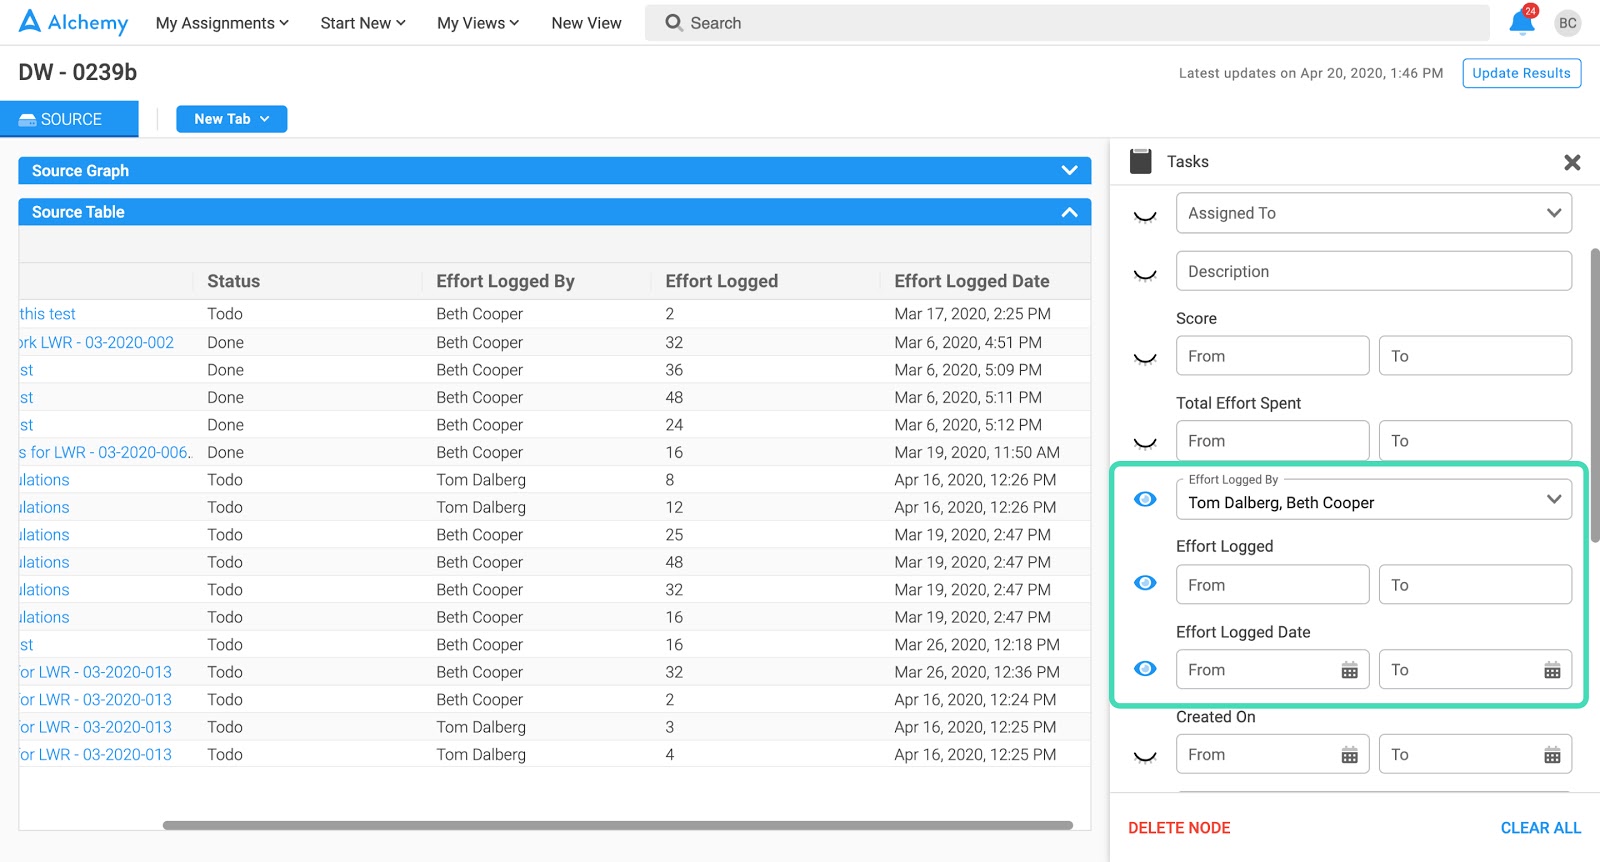
New effort logging reports can be run.
Key Benefits
In addition, you can run reports on the effort logged for each time entry in Tasks to create time tracking reports for Tasks completed in Alchemy.
As you can see in the picture below, additional information and filtering criteria has been added. Who was the effort logged by, effort logged for each time entry and the dates of the logged efforts.
2. Record Sharing Outside Your Alchemy User Base
Share Alchemy data with people outside your Alchemy user base, inside your company or outside your company.
Key Benefits
Collaboration is a major benefit of Alchemy. With record sharing we are pushing it to the next level with one-directional and bi-directional communications to people outside your Alchemy user base. Alchemy users can effectively share data from Alchemy with anyone - either inside your company or outside your company.
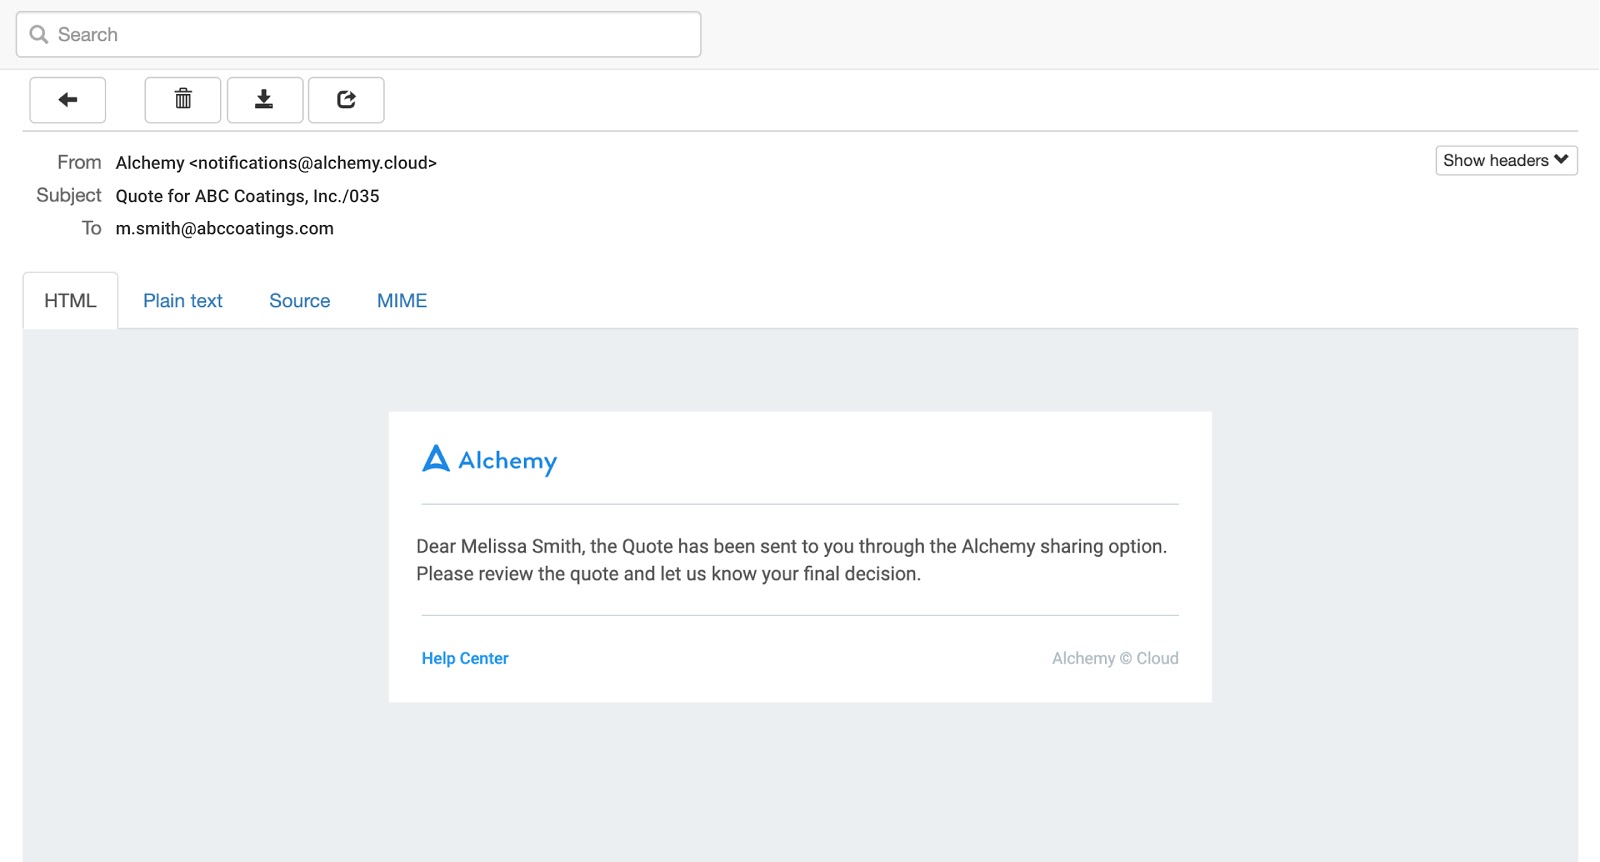
First, when a stage becomes active or completed, the Alchemy system can send an email with a message about the underlying content. This is a system-generated one directional communication based on data collected in or generated by the system. Examples of outbound communications include:
“Thanks for your request for [Company_Name Product_####]. Your request is being processed.”
“We are glad to inform you that your [Product_Category] sample has been shipped. Your tracking number is [############]. We look forward to your feedback once you have had a chance to test it out.”
“Hi [Key_Account_Manager] for [Company]. This is to let you know that the [Product_Category] lab just started work on [LabWorkRequest_Alphanumeric] for your account.
In the picture below, you can see an example email sent from Alchemy that was triggered when a new stage was activated.
Second, an Alchemy user can now share an editable Record. This is a system-generated two-directional flow of information based on data collected in or generated by the system. Use cases include requesting and receiving feedback on a sample or requesting a review by someone not normally part of your workflow.
“Now that you have had a couple weeks to test the sample we shipped you, we would love your feedback. Please fill in the form and we will automatically get your feedback.”
“Hi [SVP of R&D], given the strategic nature of this project, we want to make sure that you have visibility to where we are and also have an opportunity to provide your feedback on our plan of action at this point. Please provide your feedback and we will take action accordingly.”
Please note that a shared, editable record can have an expiration date, so that the link doesn’t stay open and changeable indefinitely.
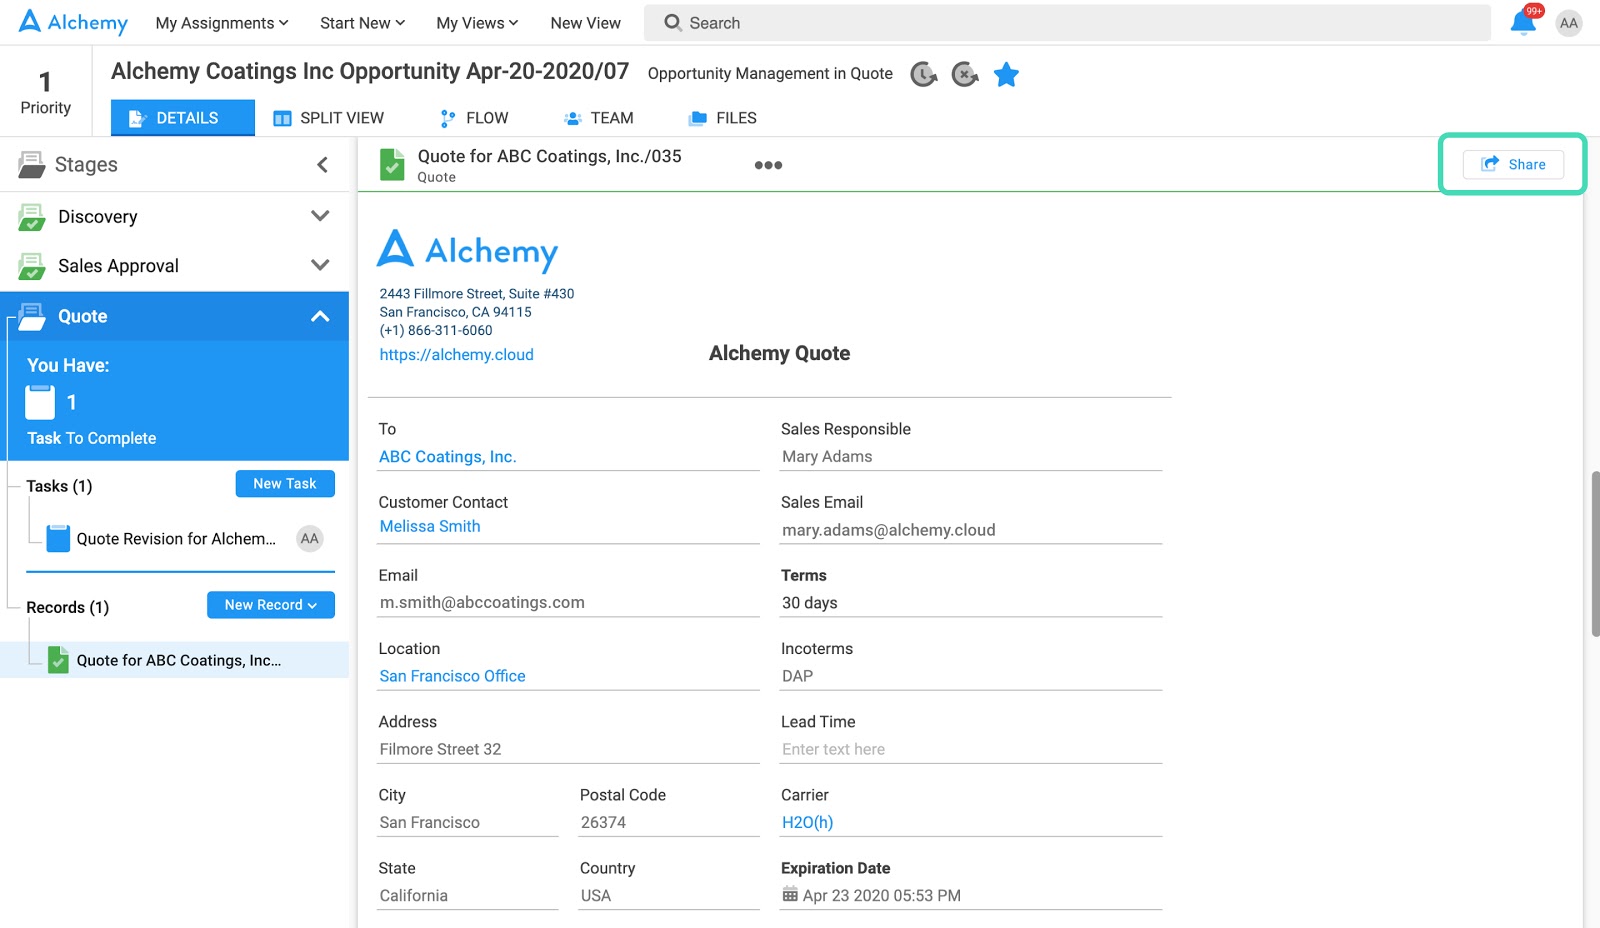
To share a record, click on the “Share” button in the upper right corner which we denoted in a green box in the screenshot below.
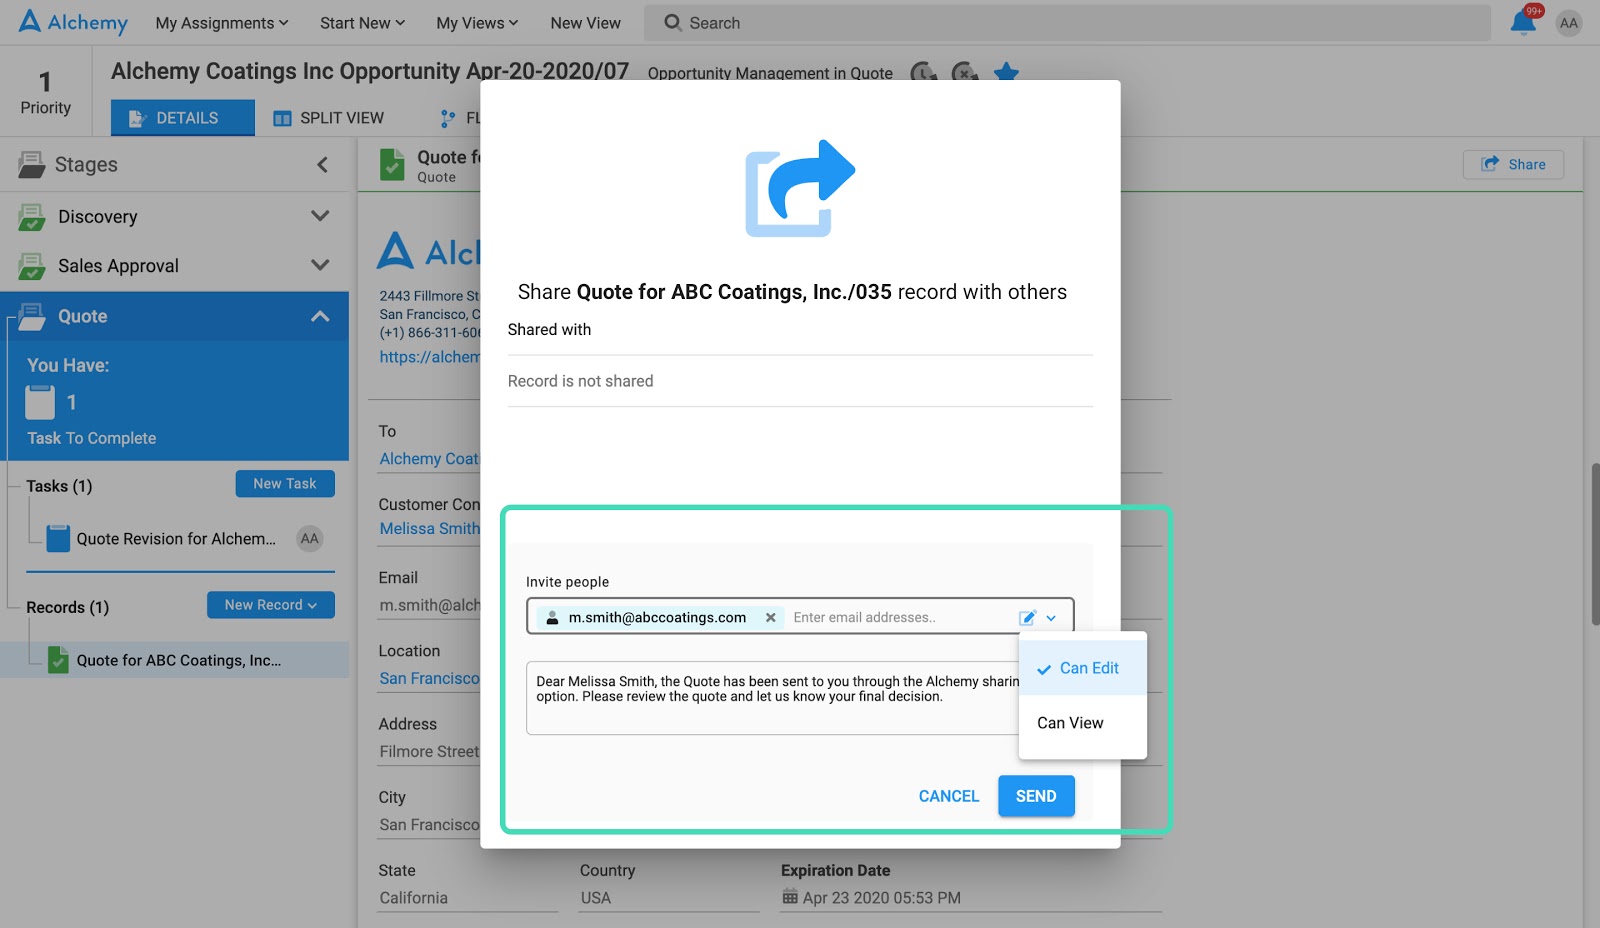
A pop-up window will appear with details for this shared record. To invite people to edit, just enter their email addresses in the “Invite people” field which we denoted in the green box in the screenshot below. With the “pencil” icon selected, the recipient can edit the record directly themselves. Below that, you can type a short note to the recipient(s) to accompany the information just like you would in an email.
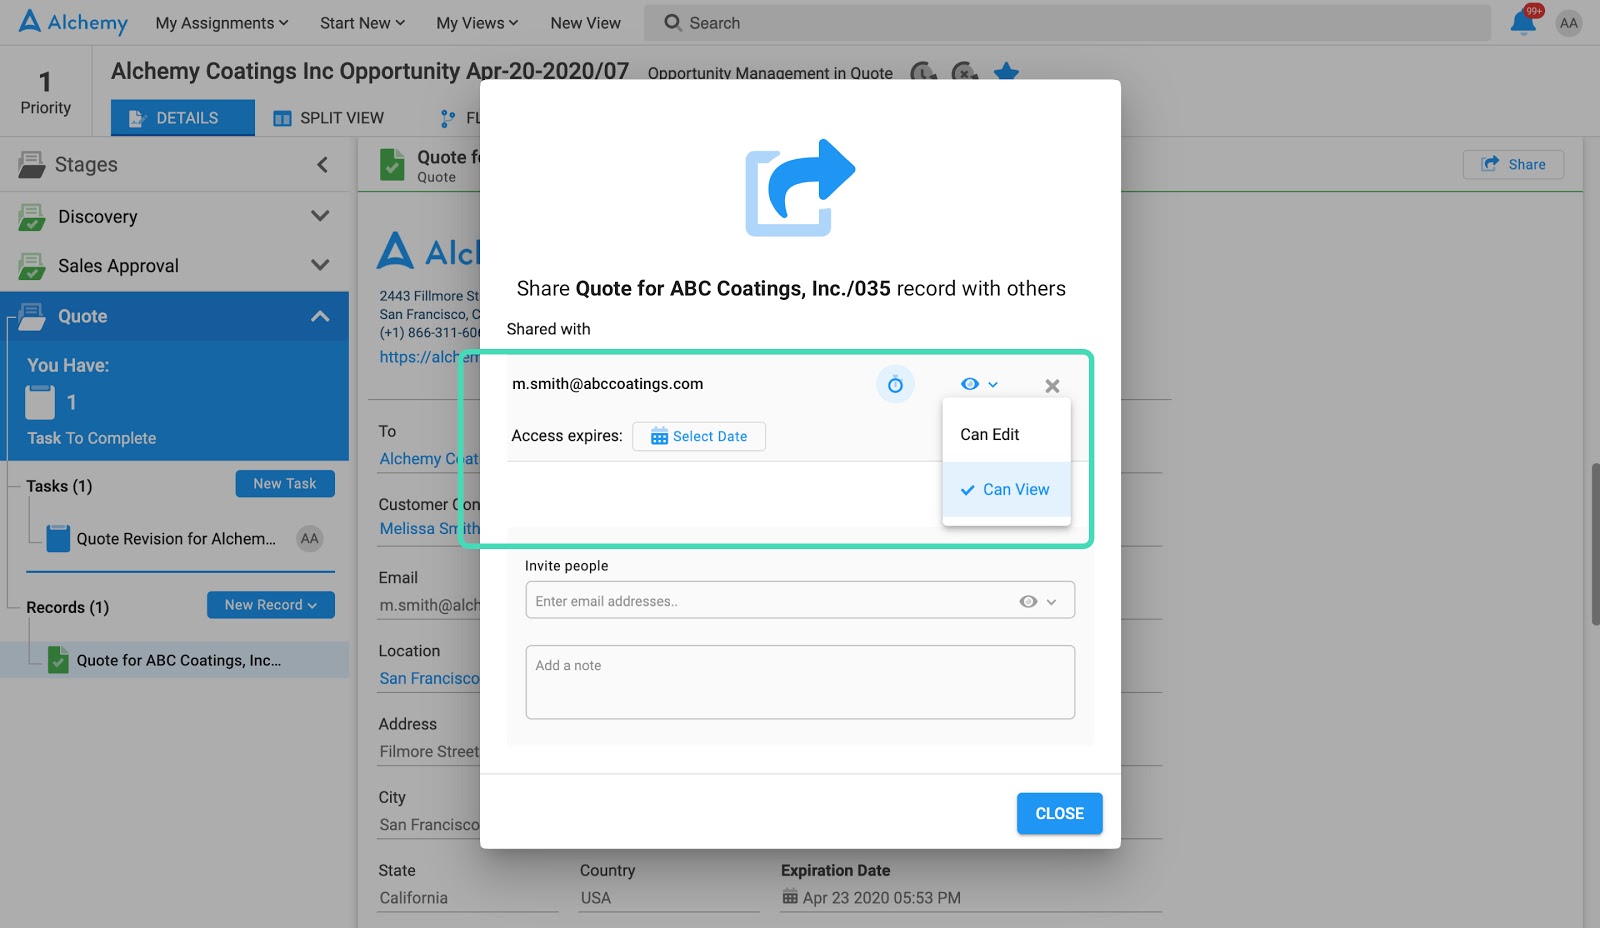
When you've added the appropriate email addresses, they will appear in the “Shared with” section which we denoted in the green box in the screenshot below. If you hover over the email you can see additional options: to set an expiration date, change edit/view rights and/or remove an email. To set an expiration date, click on the “clock” icon and select the date when the link to this shared record will expire.
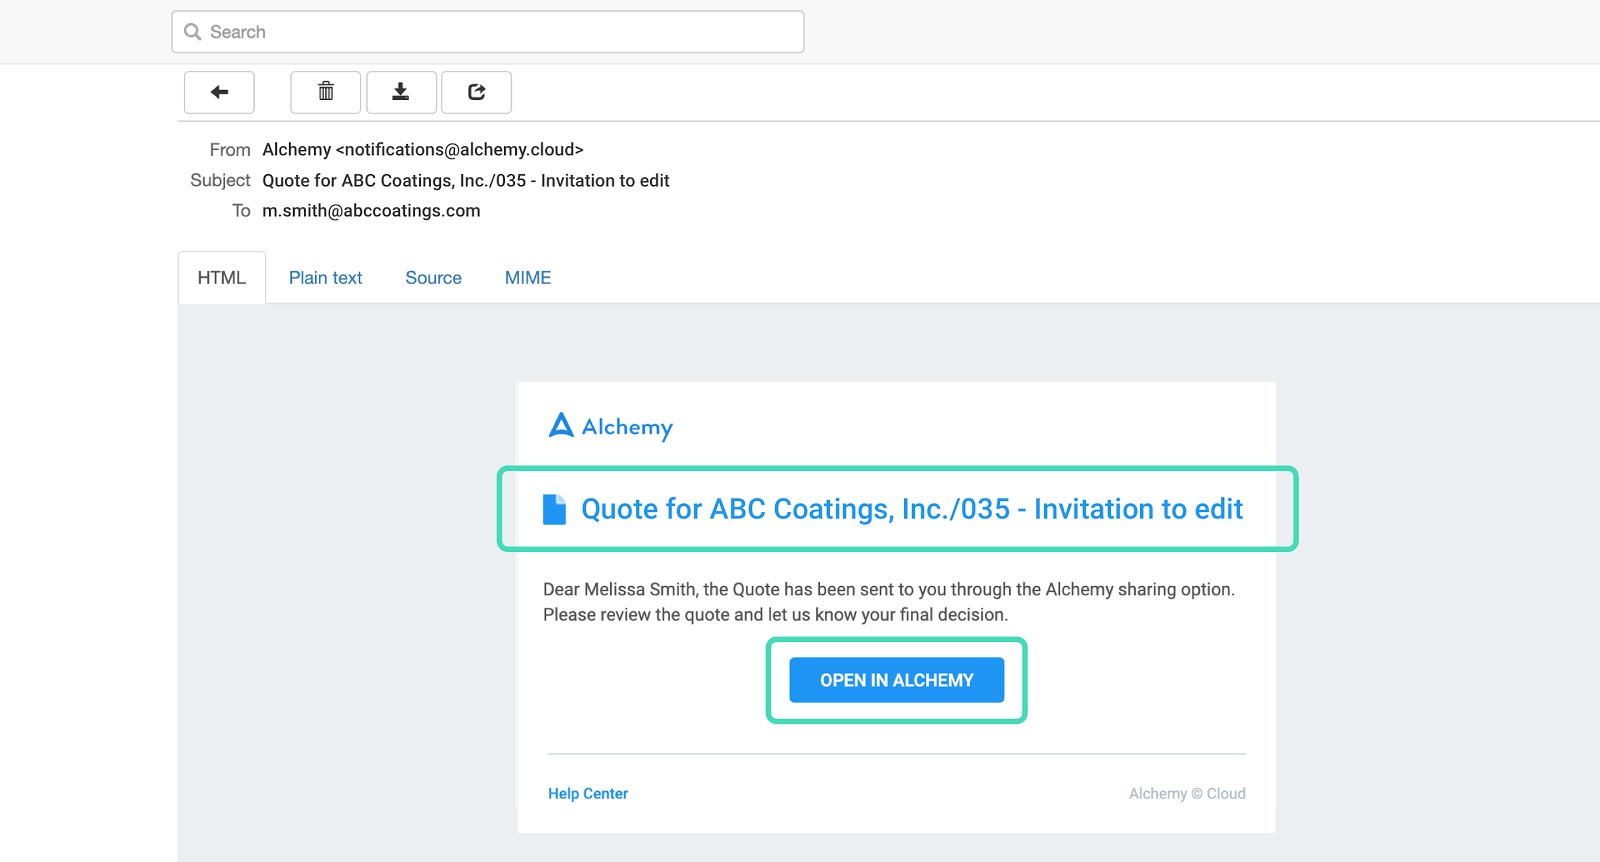
The people you have shared the record with will get an email with a link to that record. They can click on the record name or the “OPEN IN ALCHEMY” button to view or edit the shared record, both boxed in green in the screenshot below.
3. Project Planning & Gantt Charts
Create a project plan and visualize that project plan relative to actual execution in the form of a gantt chart.
Key Benefits
Create a detailed project plan by stage, including a target completion date for each stage and a target duration for each stage as independently trackable metrics.
A picture is worth a thousand words. Seeing progress relative to plan visually in a gantt chart enables 1) an easy, universally understood way to communicate status without having to type up an essay, 2) automated and therefore effortless project management for the project manager, all involved in the project and for upper management.
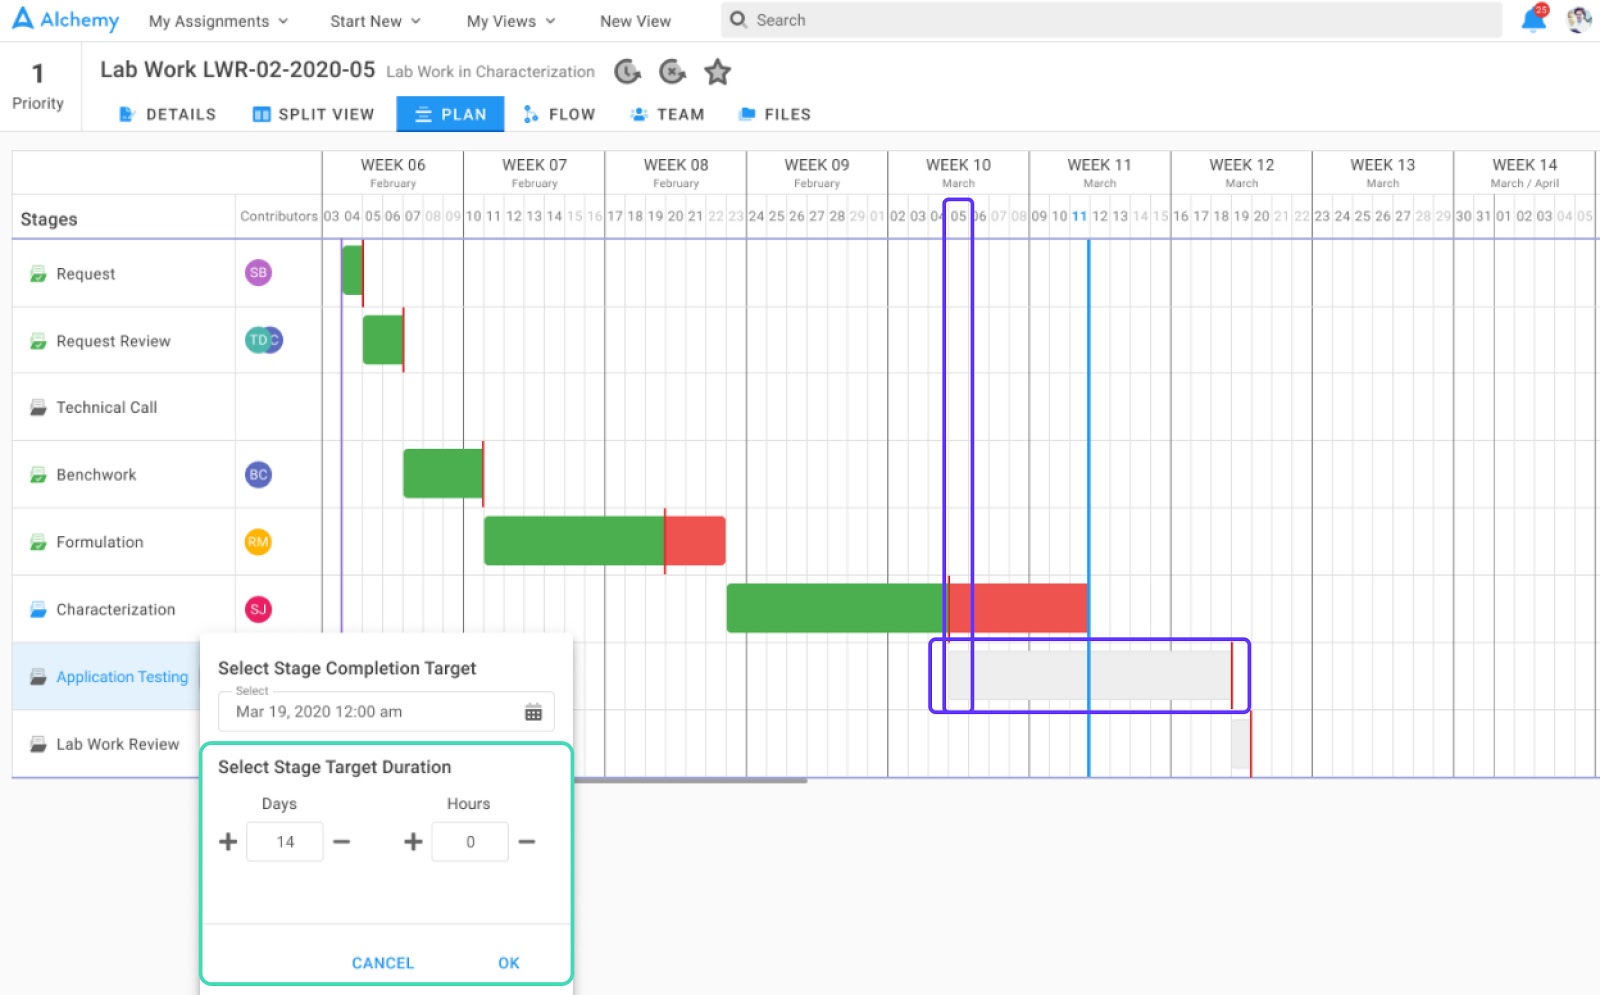
See the screenshot below where a project manager can enter a Target Stage Completion Date for each stage of a project. This is the date by when all work for this stage should be completed. The turquoise box shows a target completion date for Application Testing of March 19 and the purple box shows that date in the gantt chart represented by the skinny red line at the end of the stage.
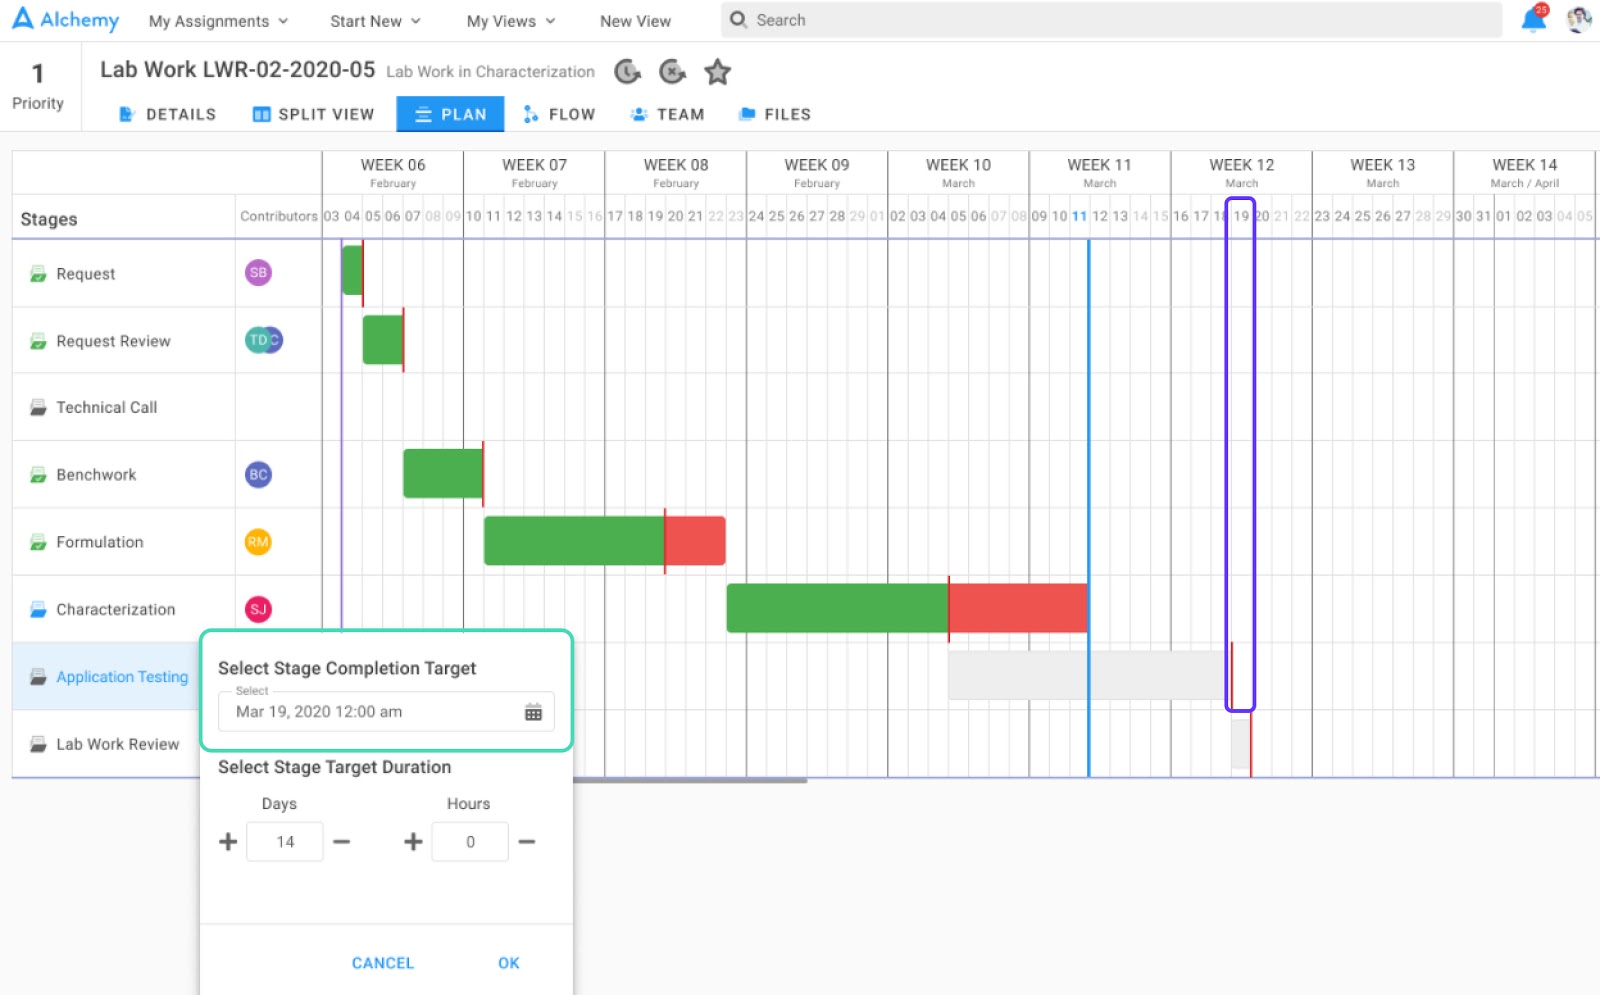
The Target Stage Duration is how long you expect the Application Testing work to take during the stage. In this case, the project manager expects 14 days as shown in the turquoise box. The system will automatically set the stage start date to be 14 days prior to the expected completion date or March 5th which you can see in the vertical purple box.
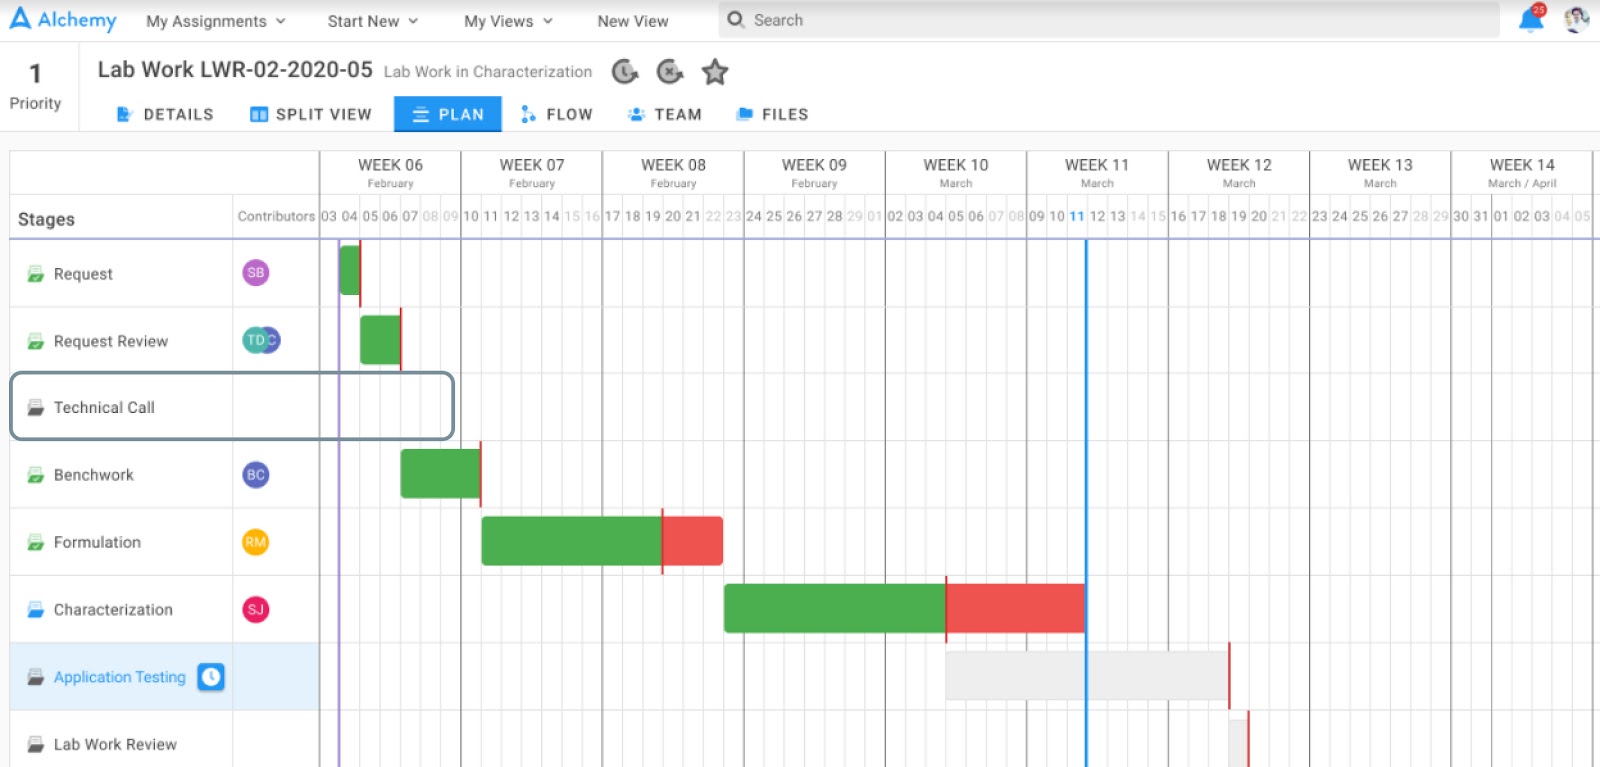
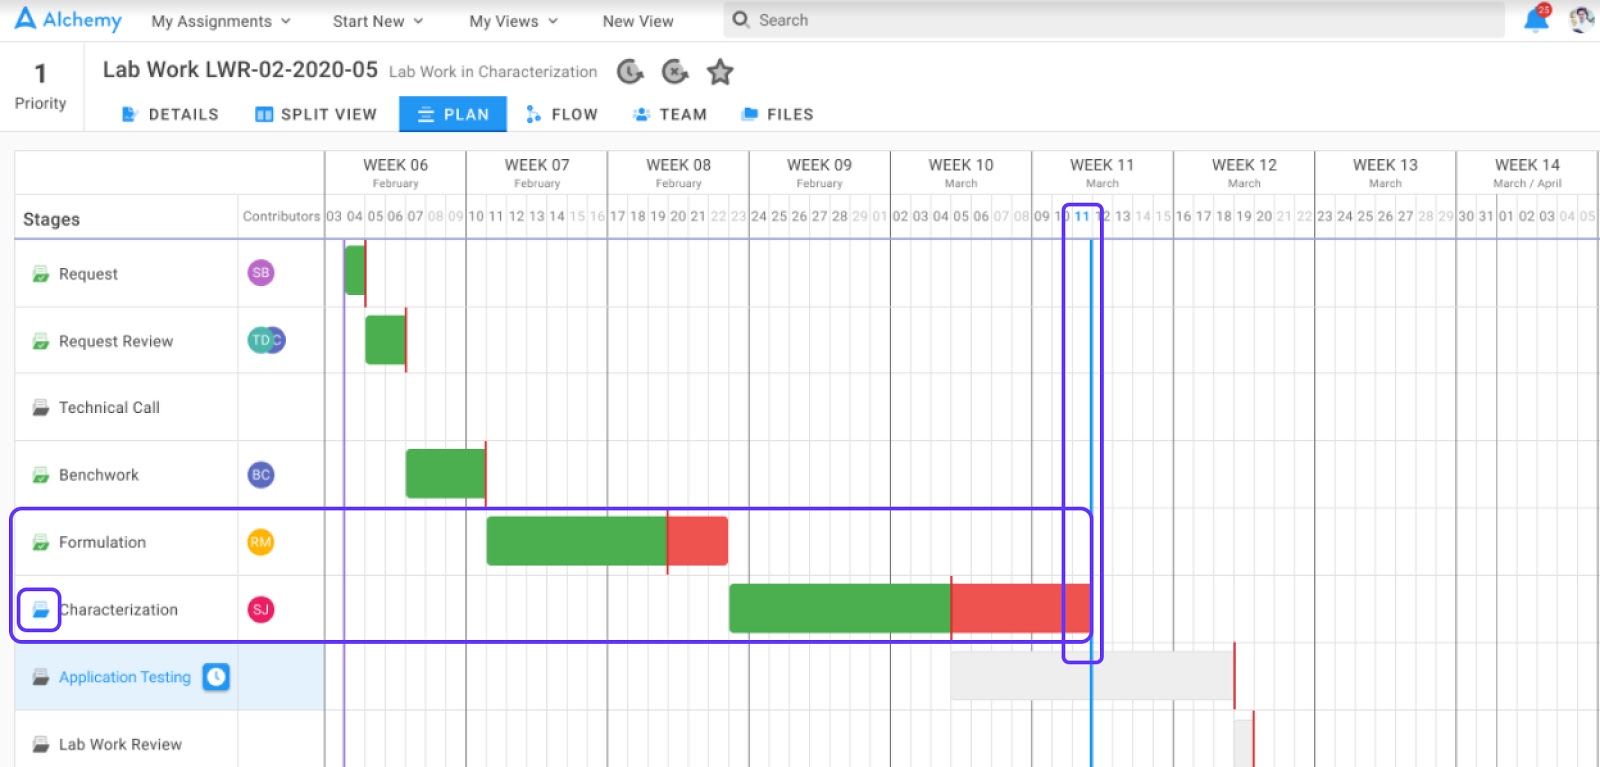
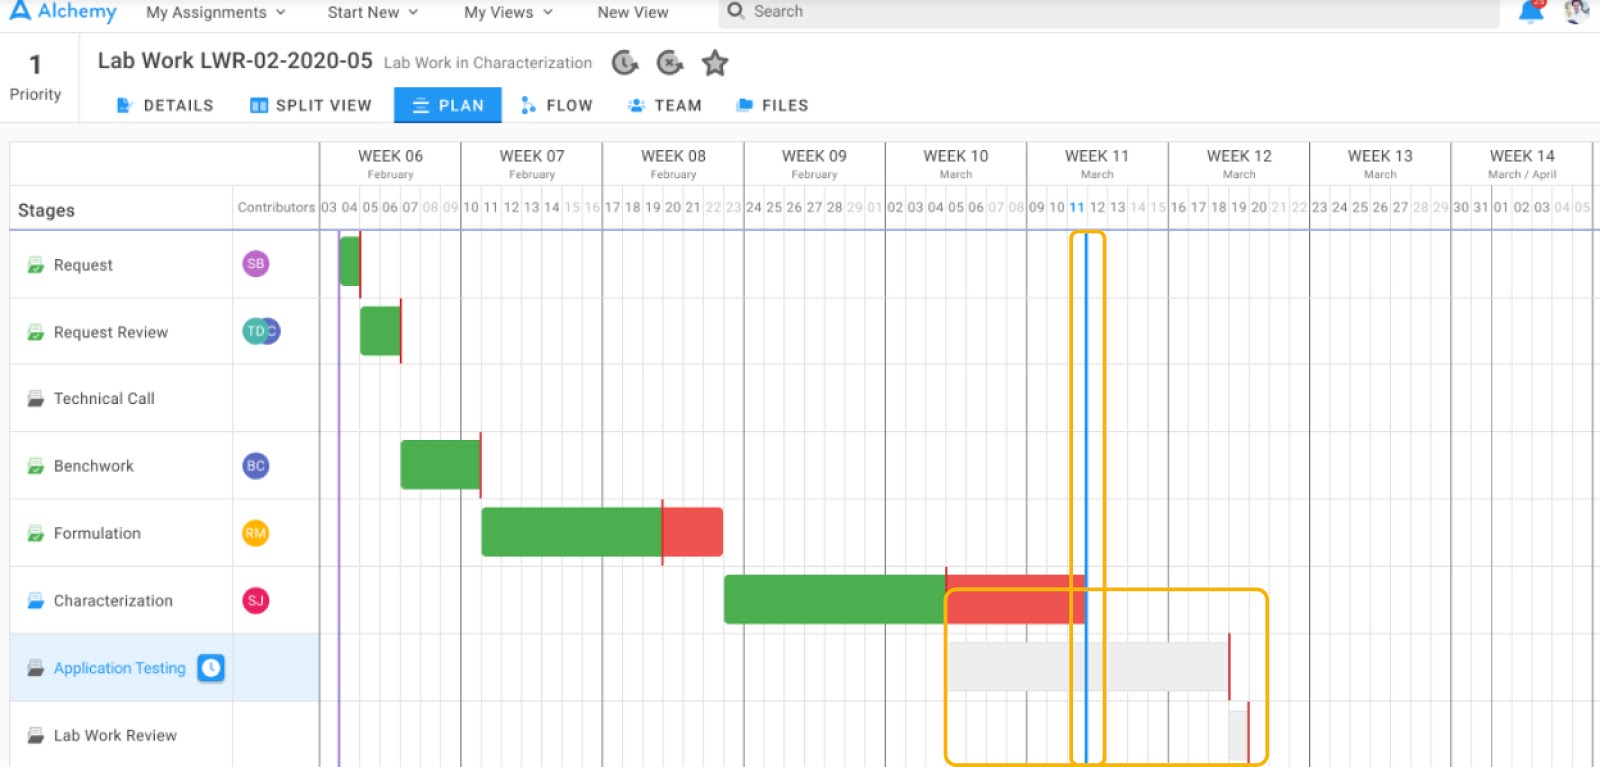
Finally, you can see four different stage statuses (or outcomes) in the screenshots below.
- Completed On Time
- Turquoise horizontal boxes
- Request, Request Review and Benchwork stages were completed on time
- Green bars represent execution
- Red skinny vertical lines represent end dates
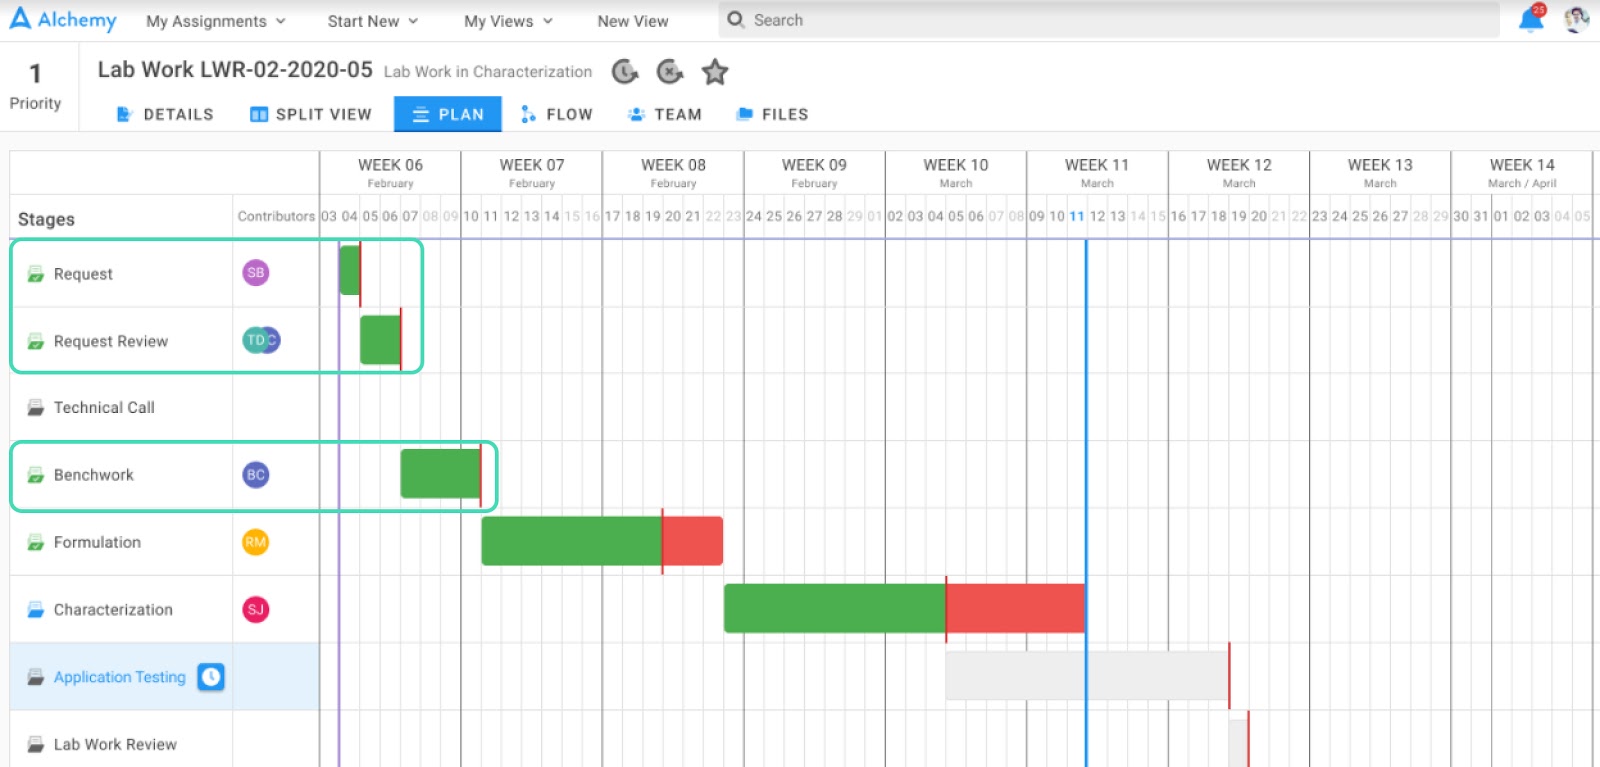
- Not Executed
- Grey horizontal box
- Technical Call stage
- No bar of any color for this stage represents the fact that this stage didn’t occur
- Completed, But Late (relative to the target completion date)
- Purple horizontal box
- Formulation and Characterization stages
- Green bars represent work before the target completion date
- The red skinny vertical lines represent the target completion date
- The red bars represent work that extended past the target completion data
- Characterization is still ongoing based on the blue folder icon of the stage in the left nav and the blue vertical line which indicates “today” in the gantt chart
- Not Yet Started
- Orange horizontal box
- Application Testing and Lab Work Review stages
- The greyed out bar in Application testing represents that this stage didn’t start when it was originally planned because Characterization is running late
- The greyed out bar in Lab Work Review represents that the stage has not yet started and was not yet planned to start.
4. New Functions - LOG & DATE FORMAT
Calculate the logarithmic value from a number parameter.
Key Benefit
To enable chemists to auto-calculate a log value in a datatable.
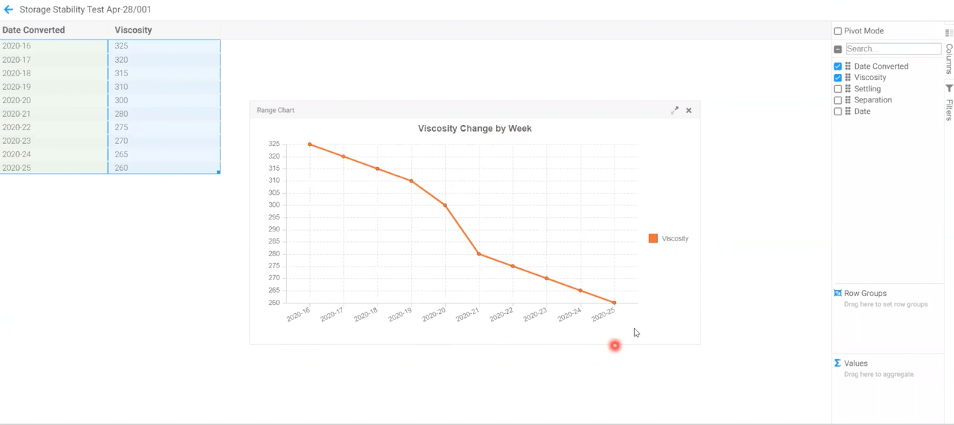
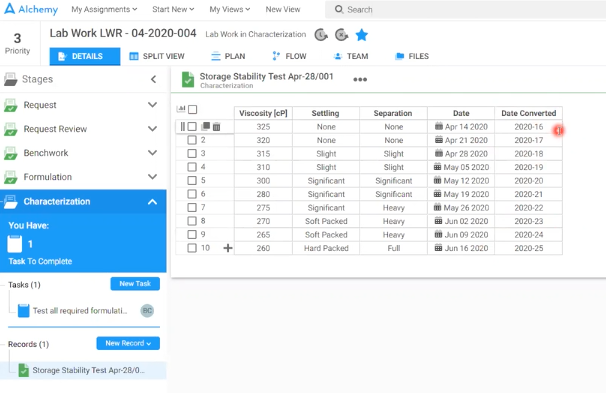
Convert a date value to a string (a sequence of characters).
Key Benefit
Allows date data to display in a textual format. For example, see the screenshots below of a storage stability test where we took the date of the test and converted it to the year and week number.
Once in this format, we can then plot the data so a chemist or lab tech can see what’s happening to viscosity over time as in the screenshot below.