Purpose
This guide outlines how to create a scatter chart in a View.
Instructions
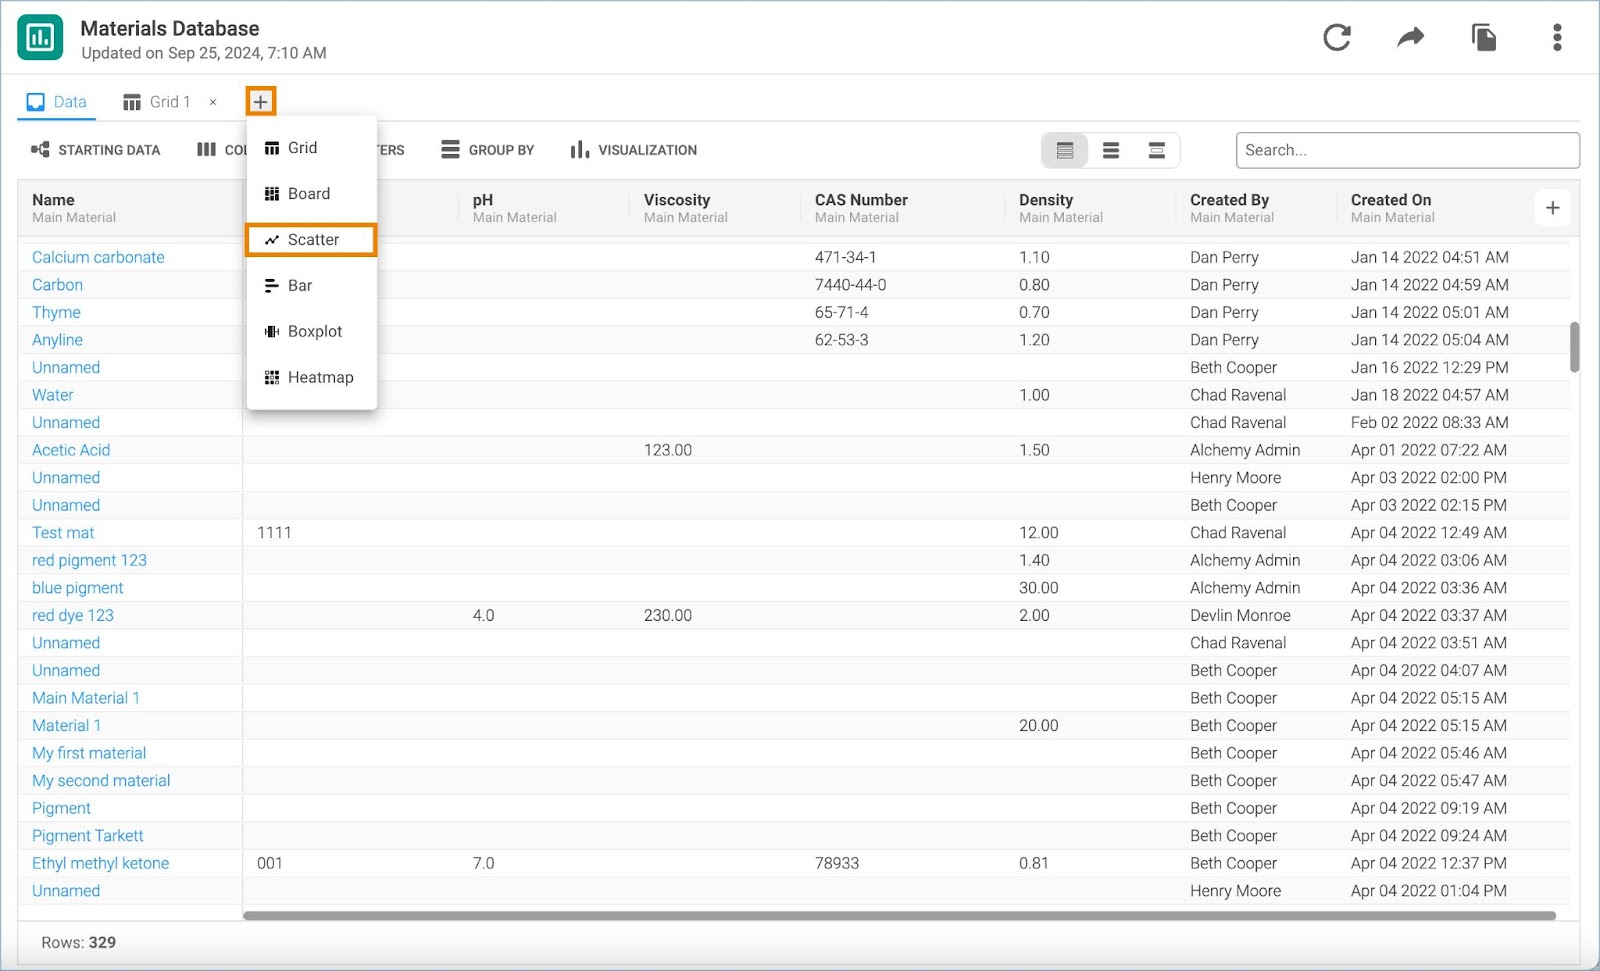
1. Click the + icon next to the Data tab to display a dropdown with various visualization options and select Scatter.
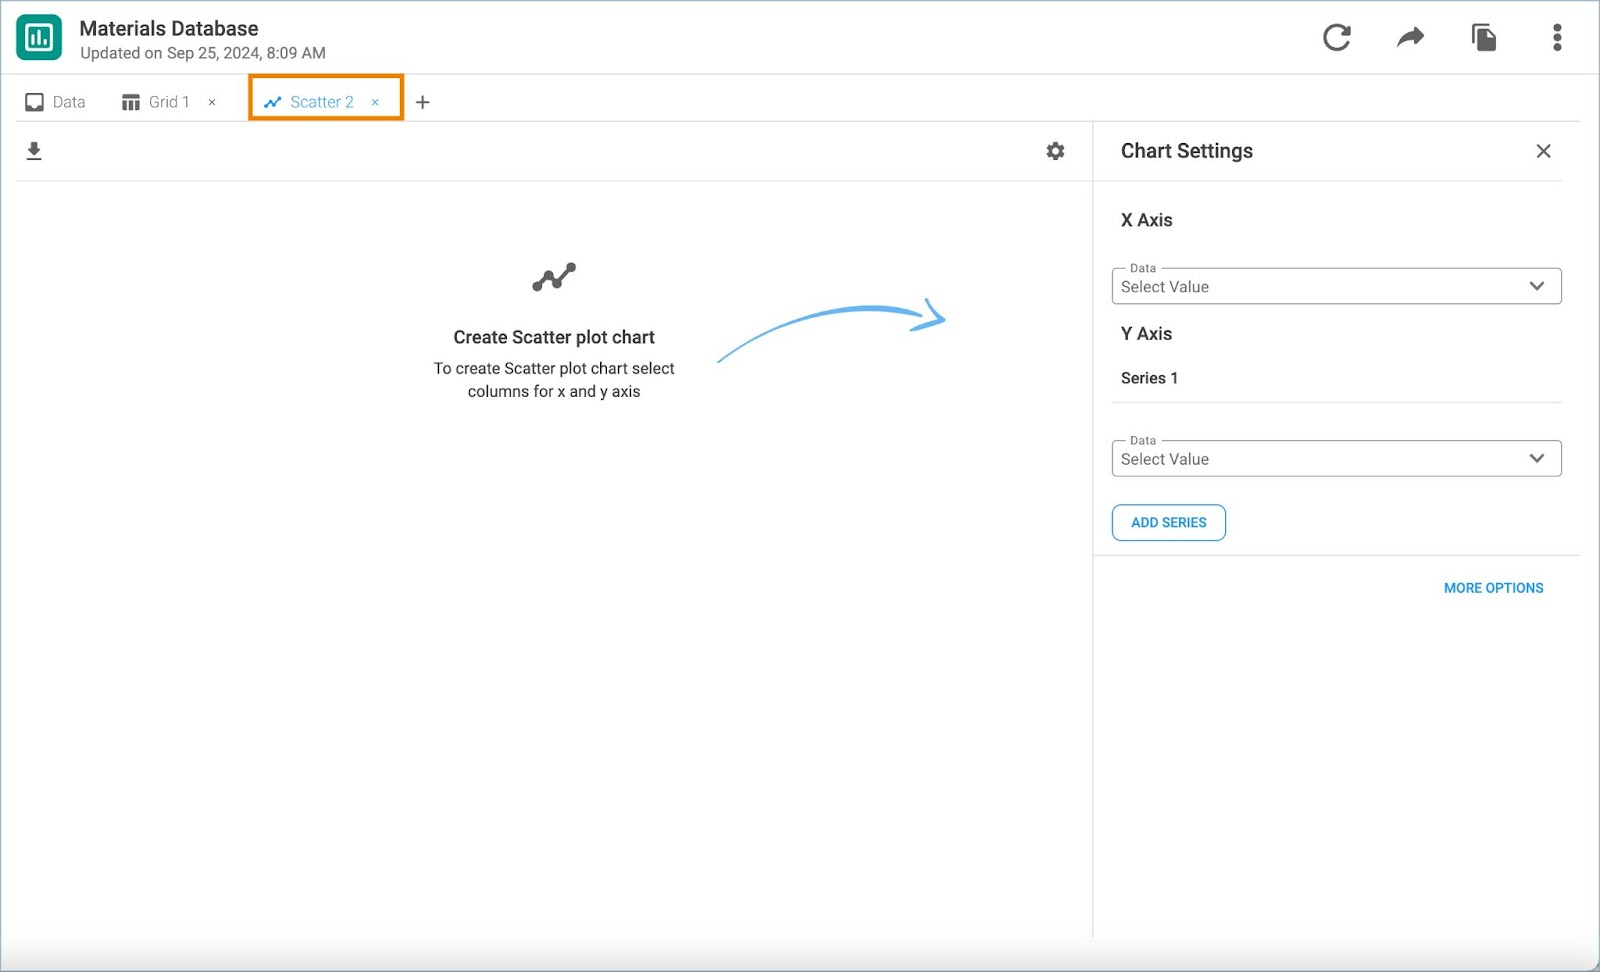
2. The chart settings window opens in a separate tab. Double click on the tab name to rename the chart.
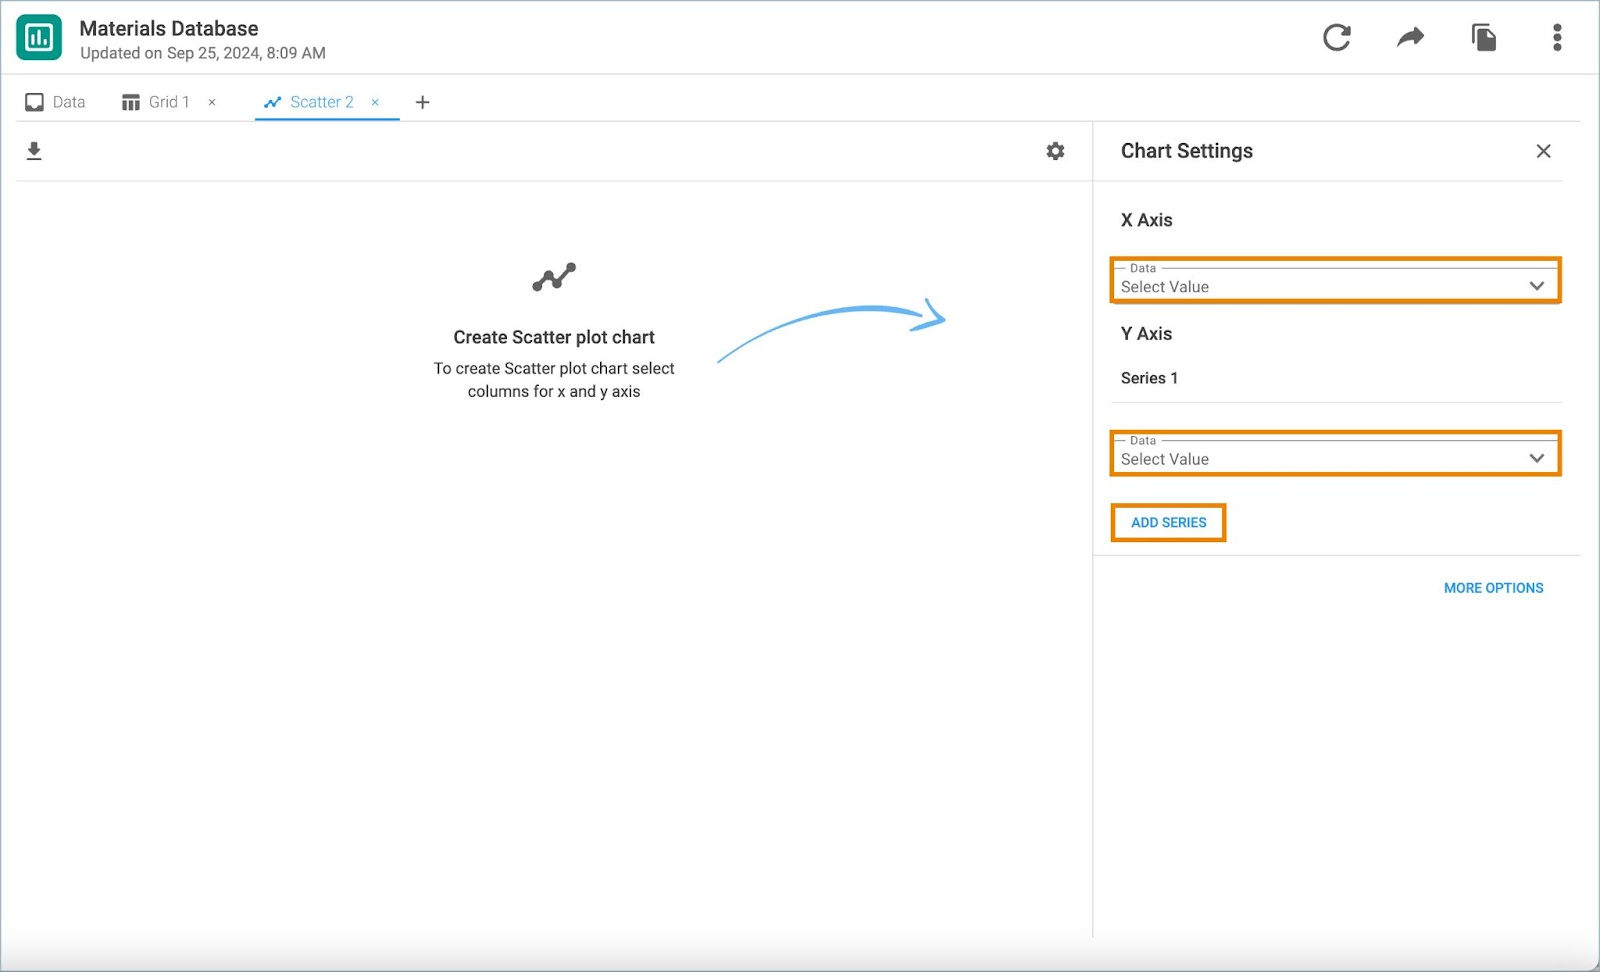
3. Select the data values to be shown on the X and Y-axis. Click Add Series to put additional data on the Y-axis.
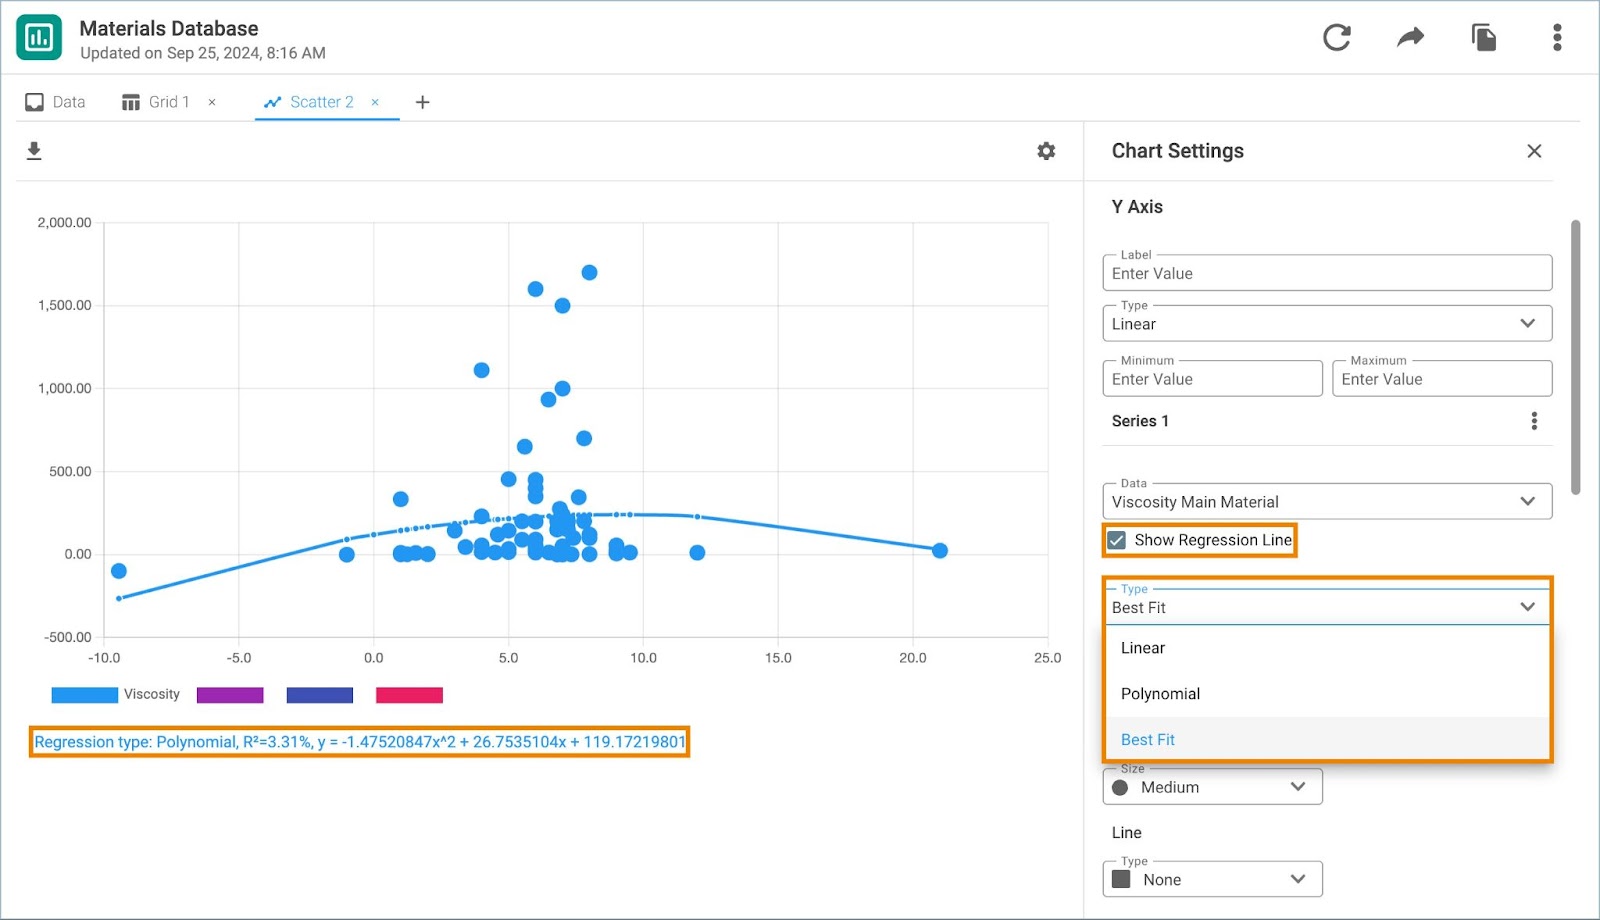
4. Click Show Regression Line and select its type from the dropdown menu that becomes visible..
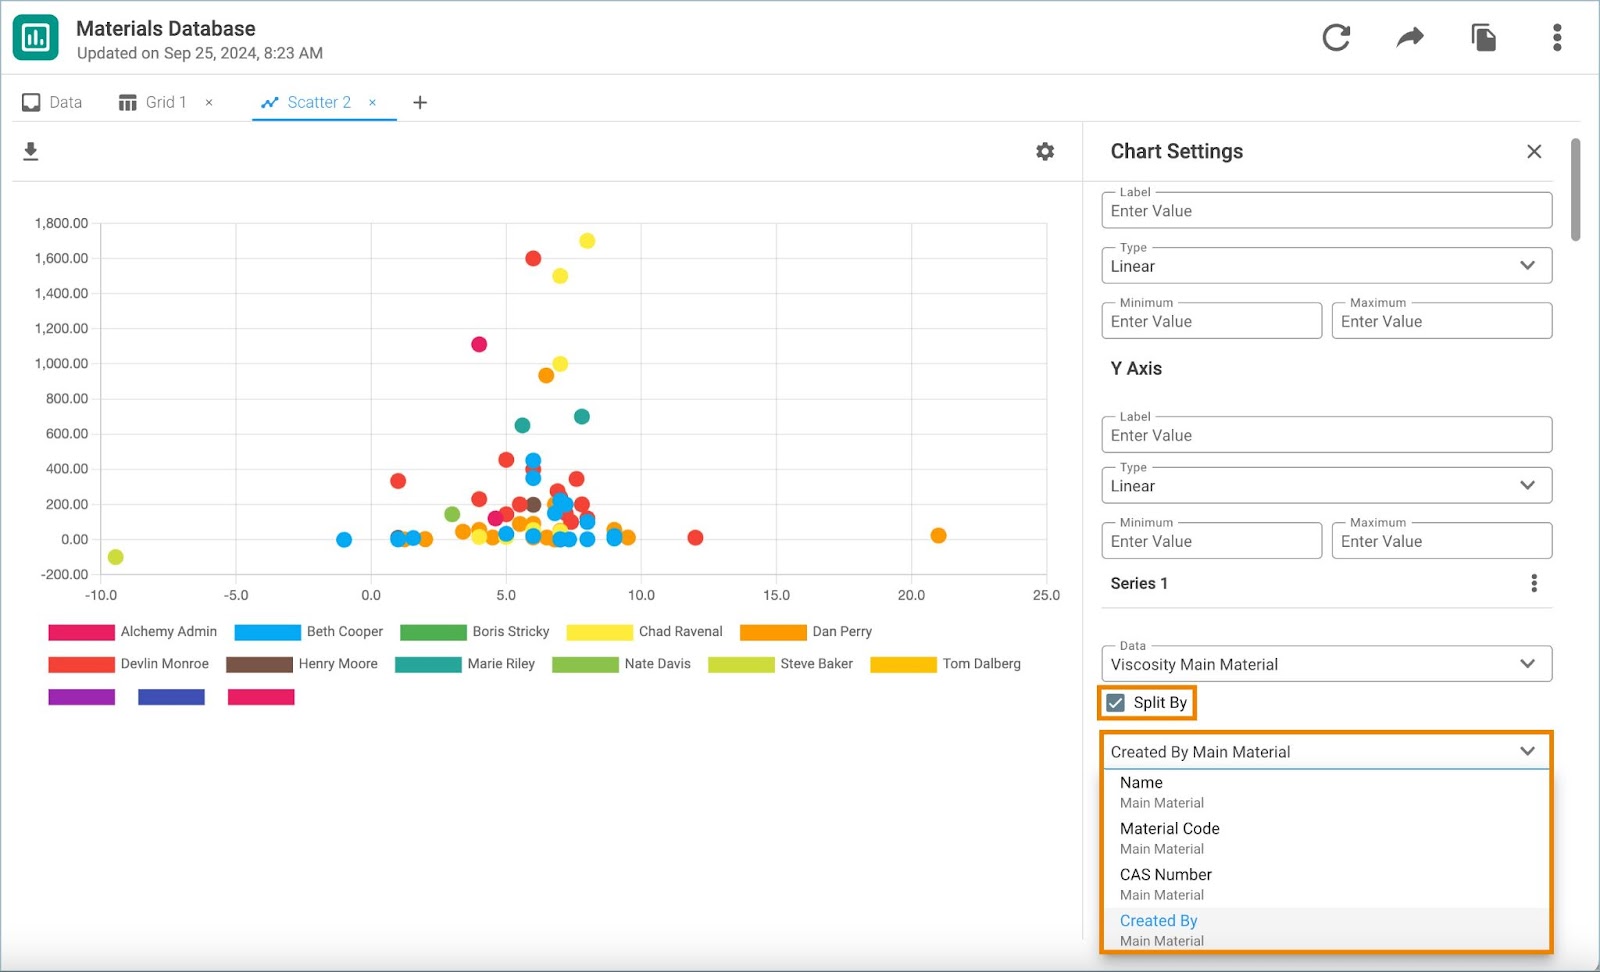
5. Select Split By to split displayed data and select the variable from the dropdown menu that becomes visible.
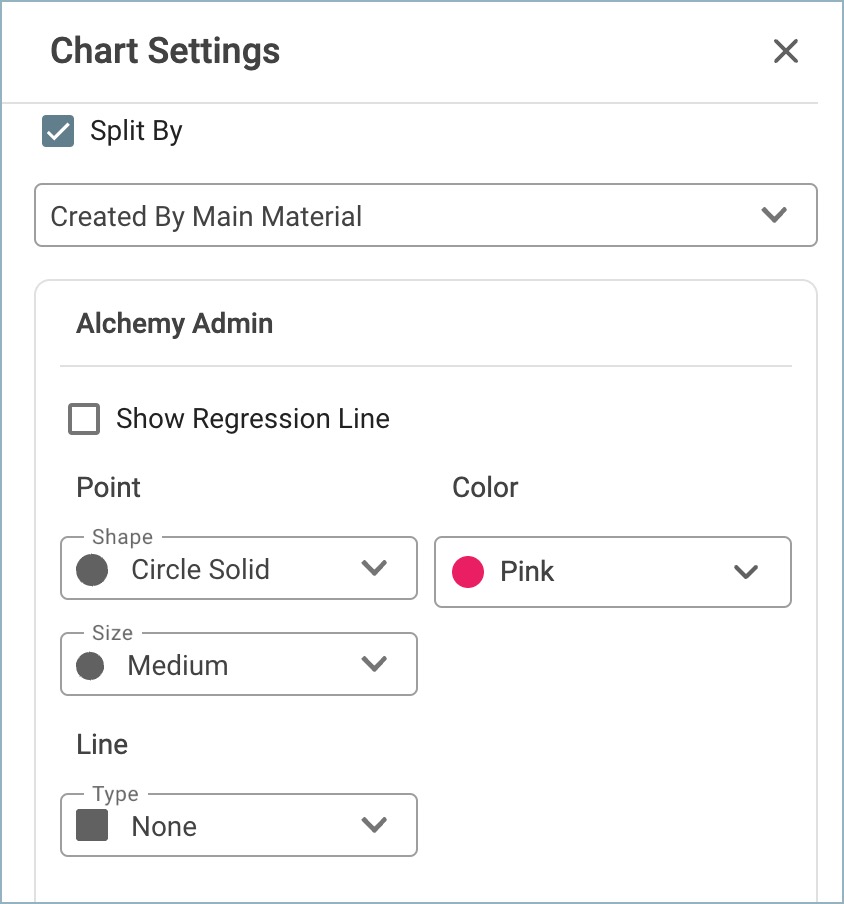
6. For each series of data select Show Regression Line. Then choose the shape, color and size of the data points, as well as the line type.
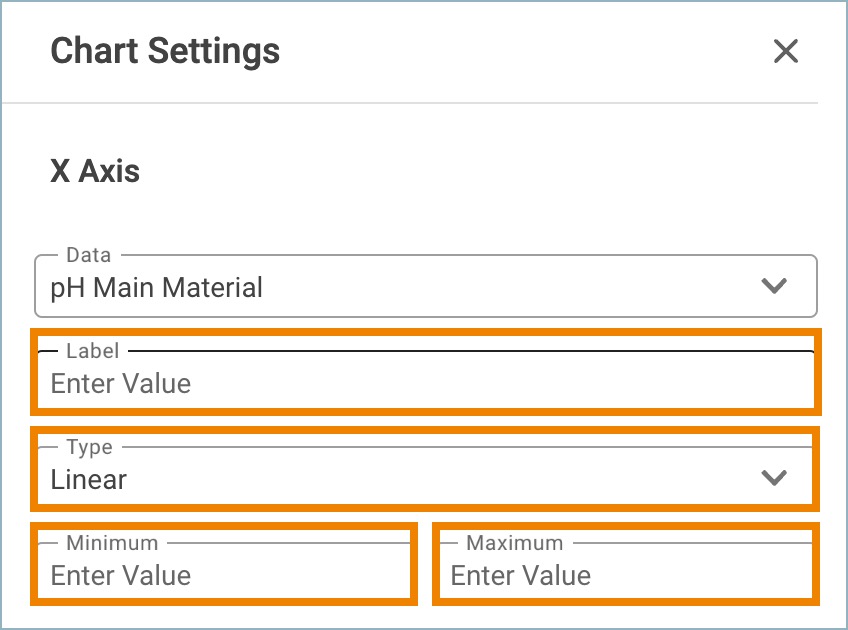
7. Click More Options to display additional fields under the X and Y-axis sections of the Chart Settings. After entering labels for each axis, choose the type (Linear or Logarithmic) and define minimum and maximum values.