Last Updated on:
August 4, 2024
Purpose
This guide outlines how to view a gantt chart of the process timeline.
Instructions
- Select the desired process from the Assignments page.

Figure 1. Select Process
- From the Process panel, click the menu icon and select Plan.
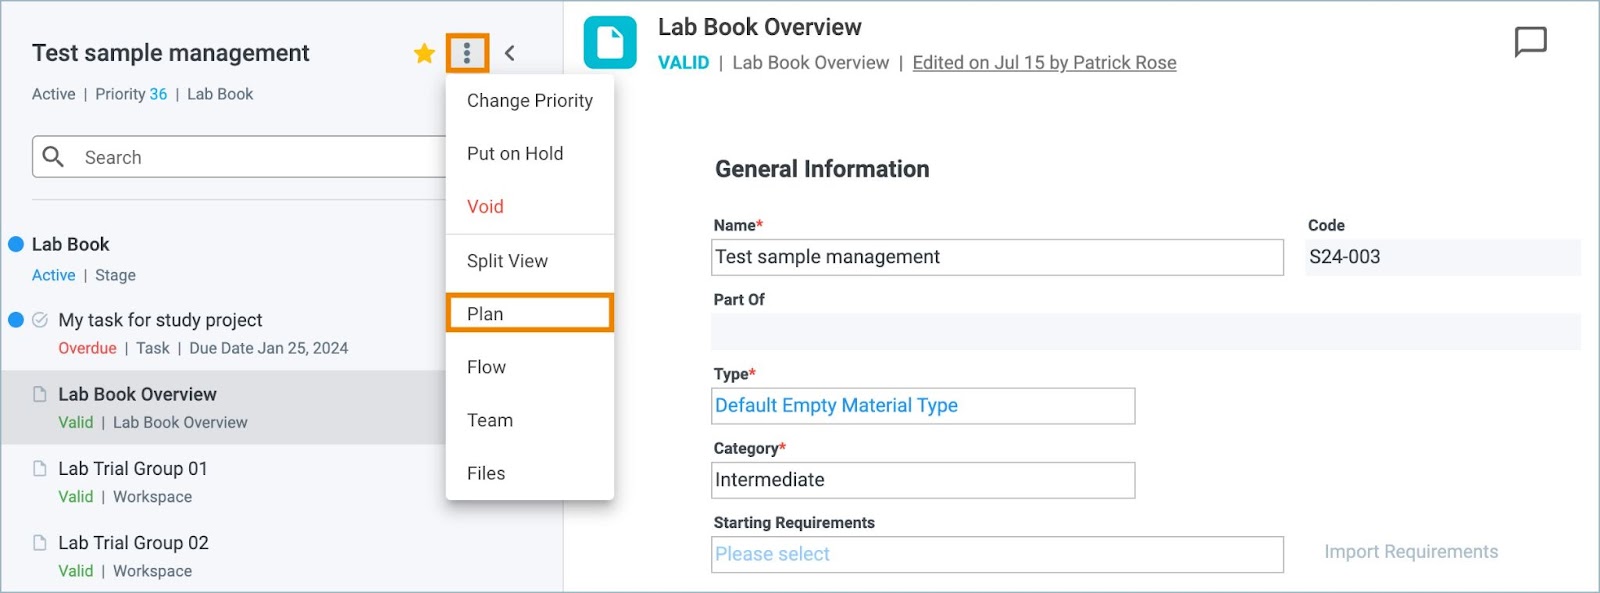
Figure 2. Process Menu - Plan
- A gantt chart is displayed. Stages of the process will be listed, along with any contributors, in the time frame.
- Green stages indicate a process is on time while red would indicate a process that is overdue.
